When catastrophic failures occur, people quickly demand explanations and start to point fingers. It takes time to get to the right explanations and point fingers in the right direction. Forensic reviews, done thoroughly, often point to underlying risks which made catastrophic failures more likely.
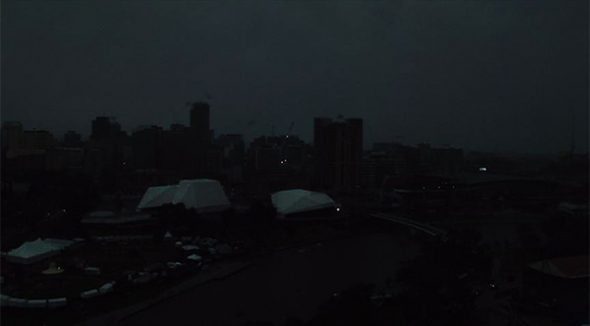
So, what can we say about the extraordinary “system black” in South Australia 20 hours (at the time of writing this) after it occurred, and after about 75% of demand has since been restored.
At the five minute trading interval starting at 16h20 NEM time (so 15h50 in Adelaide), the system was humming along as normal. The spot price was $60 per MWh, peak demand was 1686 MW of which 535MW was being met from imported power from Victoria (430 MW on Heywood and 105 MW on Murraylink).
Torrens Island was the only South Australian fossil plant producing (from two of its four “B” units, but all four of its “B” units were synchronised. The remainder of the supply was coming from wind farms of which 659 MW in the Northern region and 384 MW in the South East.
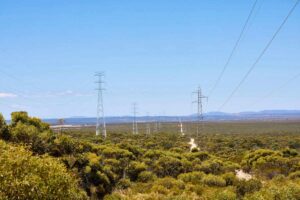
If I understand it from the limited information currently available, at around 15h40 Adelaide time, lightning and severe wind knocked out the main transmission lines bringing power from the North, and so dropping about 40% of South Australia’s supply.
The interconnectors to Victoria were already running close to import limits and so could not replace the lost supply by quickly ramping. Torrens Island, which had around 800 MW of synchronised capacity, also presumably could not ramp up quickly enough to replace the lost capacity. Presumably the loss of so much capacity would have quite quickly led to the automatic tripping of the interconnectors and hence the cascading failure of the South Australian power system.
So, what to makes of this? Its much too soon to be certain of the events and even less so what to make of them. But it seems to be the case that the trigger was transmission failure, not generation failure. Specifically, the lines and possibly also key substations bringing power from the Northern region to Adelaide.
It happens to be the case that wind farms were producing the circa 660 MW of power that was knocked off when those lines were incapacitated. But this is not the failure of those wind farms, but of the transmission capacity moving their power. It would have made no difference if the primary source of power knocked out was wind, gas or coal. Playford and Northern, the recently closed coal-plants were also on the “wrong” side of those lines and had they been producing, they too would have been knocked out by the transmission failure.
What could the synchronized gas fired Torrens’ units in the Adelaide region have done to pick up the loss? I don’t know. Was Torrens partially incapacitated in the storm? Presumably with 535 MW of import and knowledge of the lightning and winds, AEMO would have procured spinning reserve from Torrens to cater for contingencies.
We must now work towards a careful and transparent forensic analysis of this event. We must not lose the opportunity presented by this crisis to draw conclusions that reflect a rigorous and unbiased understanding of the power system, its economics and its governance. And, let the sunshine in.
My thanks to Paul McArdle (Global Roam) for his excellent animation of NEM data that has made this early note possible.


