Hazelwood’s super-profits highlight tangled web of energy policy

Total value of Hazelwood dispatch in terms of Victorian market prices, for the 4 week period from May 29 – June 25. Carbon tax contribution calculated using emissions intensity of 1.56 tonnes CO2 per megawatt hour. Costs of $2.50 per megawatt hour are from AEMO estimates(http://www.aemo.com.au/Electricity/Planning/Related-Information/Planning-Assumptions).

The Conversation

The strangeness of last Sunday …

Has there ever been better times for our electricity utilities?

Sunday is typically pretty subdued in terms of electricity demand. Consequently Sunday market prices are at the low-end of the weekly range, even with the extra demands of a chilly winter day.

Since the beginning of 2008, the Sunday market price in Victoria averages about $23 per megawatt hour, factoring out the carbon tax component. That is about half the average weekday price of $43.

Victorian wholesale electricity pricing for Sundays from 2008 on. Note the extraordinary nature of Sunday 26th, 2016. Data from AEMO’s half hour price and demand datasets. Coloured solid lines show Sunday averages. Coloured dashed lines show the volume weighted price for working week-days. Black line shows Sunday 26th 2016. Colour distinguishes carbon pricing (blue) and non carbon pricing (red) intervals. Data sourced from AEMO.

Sunday prices do vary across the year rising slightly in the winter months. Between 2008 and 2015, June Sunday prices have averaged about $31 with a high of $50 on Sunday June 1, 2008.

So what can we make of last Sunday (26th June 2016), when the volume-averaged price in Victoria was a staggering $120, almost four times above the long-term?

Last Sunday was not just a once off, as the price for every June Sunday this year topped $75 – more than 50 per cent higher than any previous June Sunday in the last 8 years.

And Victoria isn’t alone. Right across the National Electricity Market (or NEM), prices have been stratospheric. Last Sunday, South Australia topped the class at $158, closely followed by New South Wales at $133.

As pointed out in my post a week ago, in historical terms these prices are simply staggering, and it’s not very obvious why.

If these prices remain, they will have widespread consequences. So it is important to get to grips with what is going on.

Last Sunday was Melbourne’s coldest morning of the year, with several coldest-day records set across Victoria. So we might expect some extra heating was stretching the power system, helping drive up prices.

However, while the Victorian demand was higher than average for a Sunday, it was about 10 per cent lower than the Victorian average weekday demand. So we really can’t pin Sunday’s extreme prices on unusual demand. Moreover, last Sunday net Victorian exports amounted to about 15 per cent of its electricity production (see note 1). So there was no shortage of supply to meet local demand.

Victorian average Sunday electricity demand in megawatts, from 2008 on. Note while last Sunday (June 26 2016) demand was above the Sunday average, it was substantially lower than the weekday average. Coloured solid lines show Sunday averages. Coloured dashed lines show weekday averages. Black line shows Sunday 26th 2016. Colour fills distinguish carbon pricing (blue) and non carbon pricing (red) intervals. Data from AEMO’s half hour price and demand datasets.

Why are prices so high?

Rather than originating locally, the reasons for the strange pricing events on Sunday morning in Victoria, seem to reside elsewhere on the NEM. They point to the emerging issue of the inter-regional coupling, the tangle of energy policies across the NEM and other energy sectors such as gas, and the power of industry incumbents.

In comparison to Victoria, Queensland demand last Sunday morning was significantly above expectation, slightly exceeding even the weekday demand average. Demand has been growing strongly in Queensland, partly because of the commissioning of its gas export processing plants. Still, at not much more than the weekday average, it is hard to understand why last Sunday’s demand in Queensland would be sufficient to drive prices to $115. At the time coal generation was running at around 75 per cent capacity.

Queensland average Sunday electricity demand (grid-based) in megawatts, since the beginning of 2008. Data from AEMO’s half hour price and demand datasets. Coloured solid lines show medians for this period. Colours dashed lines show the average for all times of the week. Black line shows Sunday 26th 2016. Colour distinguishes carbon pricing and non-carbon pricing days.


Queensland wholesale Sunday pricing since the beginning of 2008. Data from AEMO’s half hour price and demand datasets. Coloured solid lines show medians for this period. Colours dashed lines show the volume weighted price for all times of the week. Black line shows the morning of Sunday 26th 2016. Colour distinguishes carbon pricing and non carbon pricing days.

As with Queensland, New South Wales demand was close to the highest recorded for a Sunday. But while New South Wales was importing furiously, paying what would seem to be over the odds prices, its coal generators were only running at 68 per cent capacity. Why?

In South Australia demand was not exceptional in terms of recent history, but the recent closure of Northern coal-fired power plant has significantly tightened supply settings there and made it more sensitive to the cost of marginal gas generators. Meanwhile its cleanest, most efficient, and one of its largest gas generators, Pelican Point, sits idle. Why?

Sunday was not only cold in South Australia, but it was also not very windy. As a consequence output from wind generation averaged only about 25 per cent of installed capacity. With only modest wind output, and with no coal, South Australia generation was dominated by gas, the price of which is surging on the back of increased LNG export pipeline flows (see also). In addition, South Australian consumption was heavily augmented with Victorian imports.

South Australian dispatch in megawatts for Sunday 26th 2016, showing the dominant role played by gas generators. In addition to local generation, imports from Victoria averaged around 300 megawatts over the day (see note 1).

The important point is that, for whatever reason, prices are being signalled right across the NEM, from Queensland and South Australia through to Tasmania.

This price signalling is having some paradoxical effects. Just last week, the Office of the Tasmanian Economic Regulator approved an increase in retail prices of 3.43 per cent, effective this Saturday, on the back of the high market prices in Victoria. The surprise is that Tasmania has just emerged from its own energy crisis with recent rains together with the re-connection of Basslink allowing exports for the first time in almost 10 months. Just as supply constraints relaxed for the time being and security restored though Basslink, long-suffering Tasmanian consumers are the first to be hit with price-hikes.

And in Victoria, where prices are responding to distant drivers, brown coal generators must be laughing at their good fortune.

Hazelwood’s super-profits

Across the last 4 weeks, prices in Victoria have averaged $98 per megawatt hour when weighted by volume. In Victorian market terms the total value of dispatch was worth about $370 million. That is almost three times higher than the equivalent period last year, when prices averaged $35.

Victorian price by 5-minute intervals, for the last 4 weeks. red line shown the average prices weighted by volume. Note how regularly 5-minute prices have risen to $300 per megawatt hour as indicated by the dashed line.


As with the above figure, for the equivalent period in 2015.

It is boom times for the owners of Victoria’s brown coal stations, like the French energy utility Engie that operates the Hazelwood power station.

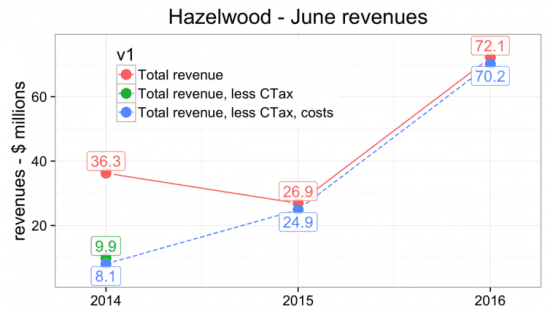
In Victorian market terms, the value of Hazelwood’s dispatch over the last 4 weeks is around $70 million.

Total value of Hazelwood dispatch in terms of Victorian market prices, for the 4 week period from May 29 – June 25. Carbon tax contribution calculated using emissions intensity of 1.56 tonnes CO2 per megawatt hour. Costs of $2.50 per megawatt hour are from AEMO estimates(http://www.aemo.com.au/Electricity/Planning/Related-Information/Planning-Assumptions).

That compares with the market value of around $25 million in June last year, and around $10 million in June 2014 when the carbon tax liability is factored out.

On an annualised basis, Hazelwood’s latest returns amount to around $900 million, a truly phenomenal turn-around from 2013 when the Commonwealth Bank sold its 8.3% stake that it had previously valued at just $1 million (see note 2).

Hazelwood is Australia’s most contentious power station – a proverbial lightning rod for the debate about our energy system. As Victoria’s oldest, most emission intensive coal fired power station it has been plagued by community concern. At around 1.56 tonnes per megawatt hour it produces about three times the CO2 of a modern gas plant such as the super efficient combined cycle Pelican Point gas plant in South Australia,Engie’s other main asset in Australia. Already it is some 10 years over its use by date.

But, in terms of its balance sheet, Hazelwood has probably never had such good times as the last few months. Meanwhile Engie reportedly disputes liability for the $18 million costs incurred by the Country Fire Authority for fighting a month long fire in Hazelwood’s mine in early 2014.

While Engie enjoys remarkable “super-profits” from Hazelwood, should we ask at what cost. With Victorian electricity exports to South Australia and New South Wales averaging around 1000 megawatts, Hazelwood arguably exists to underwrite those exports (see note 1). Meanwhile Engie’s Pelican Point Power Plant in South Australia sits idle, its gas contracts reputedly on sold presumably to the export market. If Engie were to fire up Pelican Point, it would reduce our national emissions by several million tonnes each year, and arguably put downward pressures on South Australian prices that would then be signalled across the country.

But perhaps that is exactly why. Oh what a tangled web our national energy policy is.

The headache for next Sunday

I doubt next Sunday, on the morning after the federal election, many will be watching the electricity prices. But some will, hoping the electricity market magically returns some normality. After all, it will not just be the first day of the new government, it is also the start of a new financial year.

Could it be that the current market prices are being manipulated by our electricity oligarchs to improve their bottom lines before the end of the financial year? Or will the high prices persist, reflective a fundamental shift in market dynamics, as the various threads of national energy policy tangle more tightly.

Surely we can understand that it is just not right to let the market dynamics encourage the likes of Engie to operate in Australia as if there is no tomorrow, rewarding it handsomely to dump some 15 million tonnes of CO2 into our atmosphere each year leaving Pelican Point idle. Would Engie be given license to do that in France. I doubt so, so why here?


But it is not so much Engie that is the problem, or any other player, as it is the whole tangled web of our national energy policy that is tightening at each turn. Either way, next Sunday will present the new government with the massive headache of untangling this web.

We are in desperate need of a bipartisan approach with a sharp focus on how we rebuild our energy system fit for the challenges ahead, adding environmental concerns as an equal to the existing priorities of security and affordability.

After all, last Sunday highlights that our existing energy system is not looking particularly affordable. And, like Hazelwood, much of it is beyond its use-by-date, so probably it is not that secure. And for sure it is an environmental disaster.


Mike Sandiford is a Professor of Geology, University of Melbourne. He receives funding for low emissions energy research, including integration of renewables and CCS, as well as from the ARC for geological research into plate tectonics. Source: The Conversation. Reproduced with permission.

Comments

16 responses to “Hazelwood’s super-profits highlight tangled web of energy policy”

  1. suthnsun Avatar
    suthnsun

    Somehow the ff generators have figured out how to have a last laugh at everyone’s expense, the longer we let them the more gleeful they will be. They do know it can’t last very long..

    1. neroden Avatar
      neroden

      They’re scamming the system. Look into what Enron did in California to figure out what they’re up to.

  2. David Pethick Avatar
    David Pethick

    Great analysis Mike – I don’t think there can be much doubt that all of the coal fired generators are happy with results this winter. It is becoming clear that there is little incentive for these units to be retired under the current market structure.

  3. Warwick Avatar
    Warwick

    Given swap contracts for Q2-2016 were trading around $30-35/MWh historically, where is the analysis for the payments Hazelwood would need to make on its sold contracts? Baseload generators normally sell contracts close to their maximum capacity meaning that spot revenues are likely to be close to irrelevant in estimating profit. i.e. it would be no surprise to learn that they in fact only earned $35/MWh not anywhere near $100/MWh…

    1. frostyoz Avatar
      frostyoz

      Agree. You can’t just analyse spot market outcomes and assume that goes into the pockets of generators. Usually close to 100% of normal load is hedged via OTC and exchange markets. The spot market is just a small piece of the picture.

      1. A1 Avatar
        A1

        Mike wouldn’t have access to those.

        Probably the most relevant missed point is that you dont turn a profit on a 30+ yr asset based on one day in the market.

        1. Analitik Avatar
          Analitik

          Surely the Melbourne Energy Institute should have access to the relevant pricing information

    2. David Pethick Avatar
      David Pethick

      Fair call Warwick, but obviously there is the secondary benefit of higher spot prices. Q2-2017 is bid $49 as I write this. I haven’t followed the market closely for a few years, but I would guess that this recent demonstration of price setting capability would have pumped up the forward market a bit.

      Cheers.

      Dave P.

      1. Warwick Avatar
        Warwick

        This is true, but I would expect that they would already have sold a fair share of their contracts 1 year out (probably according to risk management policy) . i.e. they may sell a minority of their contracting at $47 and much at low $30’s….so perhaps next year they may earn high $30’s?…but nowhere near $100. High spot prices are generators signalling to retailers to contract but are a poor guide to profits due to high levels of contracting, particularly on base load power stations.

        1. Zoe Hungerford Avatar
          Zoe Hungerford

          Thanks for these comments… out of curiosity, do you have any idea if there would be significant amounts of spot exposed generation from other generator types (e.g. hydro or gas)? As far as I can work out, both swap and cap contracts would limit the ability to try to push prices up above the level of the swap or the cap (as you would be then run the risk of having to pay the swap/cap when not generating to cover the cost)..? Looking at the bid stacks of hydro/gas I would have guessed that the significant portion of capacity that is bid in at $5000/MWh+ was not covered by contracts, do you have any idea if that’s likely to be the case? thanks!

  4. MaxG Avatar
    MaxG

    Remember this line from the little guy who went on about the mobile phone companies in a movie with Danny Glover and Mel Gibson: and they f* you and they f* you and they f* you…

  5. Hendo Avatar
    Hendo

    Just a tad off topic….I am wondering just what Australian tax Engie is paying. I would not be surprised if their tax was minimised by using off shore “debts”, adding to the already high environmental costs of hosting them.

  6. Radbug Avatar
    Radbug

    I’m fed up with these clowns. I’m going with roof top PV + storage ASAP.

    1. MrCyberdude Avatar
      MrCyberdude

      Great, just make sure that I’m not subsidising a single cent of your installation or FIT.
      BTW, best of luck with a 25 year warranty and the company still being around when you need it in less than 10 years time, even Tesla which I’m rooting for is sailing close to the wind by considering bailing out Elon Musk’s failing solar company.

  7. phred01 Avatar
    phred01

    the smell of Libor is in the air

  8. MrCyberdude Avatar
    MrCyberdude

    Wow!.. Boy is this article is flawed!
    The power generators have most of their MW’s contracted, so the market price is only paid for generation above their contracted generation. If Engie cannot produce what they have contracted for, then the company will have to pay the contract shortfall, at whatever the market price is.

Get up to 3 quotes from pre-vetted solar (and battery) installers.