The reduction would leave UK CO2 emissions some 36% below 1990 levels. The huge fall in CO2 from coal use in 2016 was partially offset by increased emissions from oil (up 1.6%) and gas (up 12.5%).
These findings are based on Carbon Brief analysis of Department of Energy, Business and Industrial Strategy (BEIS) energy use figures. This analysis has proven to be accurate in previous years (see below). The department will publish its own CO2 estimates on 30 March.
Update 6/3: Carbon Brief’s analysis has been reported by the Financial Times, the Press Association and Business Green.
Coal crushed
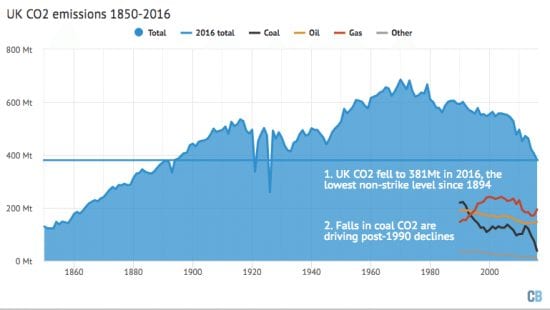
The most dramatic change in 2016 came from coal emissions, which fell by 50% compared to a year earlier to around 37 million tonnes of CO2 (MtCO2). A decade earlier, in 2006, UK coal emissions stood at 137MtCO2. These CO2 cuts are down to falling demand for coal.
Coal use had already reached record lows in 2014 and then again in 2015. Last year set another record low, with demand halving to 18 million tonnes (Mt). The 52% drop was the largest recorded in percentage terms. It outstrips even years with miners’ strikes (1921,1926 and 1984), when coal use fell by around 30% before rebounding a year later.

Coal use has fallen 74% since 2006 and is now 12 times below the record 221Mt used in 1956. UK coal demand has fallen precipitously because of cheaper gas, the expansion of renewables, falling demand for energy and the closure of Redcar steelworks in late 2015.
Perhaps the most consequential factor, however, is the UK’s top-up carbon tax, which doubled in 2015 to £18 per tonne of CO2. The future of the carbon price floor is uncertain; it has only be fixed out to 2021.
On Wednesday, chancellor Philip Hammond’s budget is expected to set out the future path of the tax, which will have wide-ranging reverberations on planned coal phase out, the cost of low-carbon power subsidies and beyond. The steel industry has long lobbied against the tax, despite being shielded from 85% of its cost.
Last year, three coal-fired power stations closed in the UK and shifting wholesale energy prices pushed coal to gas across Europe, a shift that amplified the impact of the carbon price floor. As a result, UK windfarms generated more power than coal in 2016, even though wind output declined slightly compared to the very windy year in 2015.
Gas glut
While CO2 emissions from coal collapsed, CO2 from gas increase by 12.5% in 2016, as electric utilities switched from burning coal. It’s worth noting that despite this increase, gas use remains well below the highs seen in the 2000s.
Gas use for home and business heating has been falling for a decade, as more buildings are insulated and more efficient boilers get installed. Since heat demand rises and falls with the weather, this falling trend has come with ups and downs.
Note that while building energy efficiency has increased compared to a decade ago, the rate of progress has ground to a halt. This week, the UK Green Building Council said 1.4 homes would need insulating every minute, between now and 2050, if carbon targets are to be met.

CO2 emissions from oil also rose in 2016, though by only 1.6%. This was the second year running with a slight rise in oil use and emissions. Low oil prices and economic growth mean more miles are being driven in the UK.
Since 2010, drivers have benefitted from an effective tax cut worth £4.5bn a year. The government has not raised fuel duty in line with inflation and has cancelled a string of planned increases. At the budget, on 8 March, chancellor Philip Hammond will decide whether to postpone duty rises again.
Emissions down
UK emissions fell by 5.8%, Carbon Brief analysis shows. This is a relatively significant cut for a single year, though it was beaten by cuts of 8.7% in 2011 and 8.9% in 2014. All told, CO2 emissions in 2016 were around 36% below 1990 levels (see table, below).

The third carbon budget for 2018-2022 calls for a 35% reduction in UK greenhouse gas emissions, compared to 1990 levels. But the accounting method used for compliance purposes is complicated, making it hard to gauge whether the UK has already met its 2020 goal. UK greenhouse gas emissions were already 38% below 1990 levels in 2015.
UK carbon budgets cover a basket of six greenhouse gas emissions, not just CO2. Carbon Brief estimates that UK greenhouse gas emissions in 2016 were 42% below 1990 levels. Note that this estimate is much more uncertain than the CO2-only figures.
An amendment passed by the House of Lords last year would have changed UK carbon accounting so that these actual emissions were used for compliance with the Climate Change Act. However, the amendment was rejected and removed by the House of Commons.
This debate is taking on renewed significance, given the possibility that the UK could withdraw from the EU Emissions Trading System (EU ETS) when it leaves the European Union. This would probably necessitate a rethink on UK carbon accounting, among a long list of issues it would raise.
CO2 emissions in 2016 were around 381MtCO2, Carbon Brief analysis suggests. Outside the 1920s general strikes, this would be the lowest level since 1894, when the Manchester ship canal opened, Nicholas II became Tsar of Russia and Karl Benz patented his gasoline-powered car.

Oil-related CO2 emissions have fallen from 197Mt in 1990 to 147Mt in 2016. This is because of a reduction in oil use for electricity generation, heating and for the chemical industry. Road transport emissions are almost the same today, as they were in 1990.
Carbon Brief calculations
Carbon Brief’s estimates of UK CO2 emissions in 2016 are based on analysis of provisional UK energy use data published by BEIS. The same approach has accurately estimated year-to-year changes in emissions over the past six years (see table, below).
For instance, Carbon Brief estimated a 4.3% fall in UK CO2 emissions between 2014 and 2015. BEIS (then DECC) subsequently reported a 4.1% reduction. Similarly Carbon Brief estimated a 9.2% fall in UK CO2 emissions in 2014. DECC later reported an 9.7% reduction.
It’s worth noting that both the energy use and CO2 emissions data are subject to revision. While DECC provisionally reported a 9.7% CO2 cut for 2014, its final data showed an 8.9% reduction.

Source: Carbon Brief. Reproduced with permission.