Today’s Graph of the Day comes from the Independent Systems Operator in Western Australia, which we highlighted last month, noting that live wind generation is now visible in a real time, easy-to-understand graphic display.
Today’s graph is notable because it shows that wind energy provided for around 25 per cent of the state’s energy needs on Tuesday, from around midnight till around 4.30am, when demand from the early rising locals began to ramp up. Output from the state’s wind energy power stations remained fairly constant till around 7pm, when our graph ends.
Later that day, at noon, demand on WA’s main grid, the SWIS (South West Interconnected System) was 1,681, with 412.3MW coming from renewables, almost all of it wind energy. That accounted for 24.5 per cent at midnight.
At noon (the very thin vertical line after the morning peak), there was 2,169MW of demand, wind was still providing 402MW. Add in a percentage of the 310MW rooftop solar capacity (which is not measured on this graph in either demand or supply), then it is likely that wind and solar contributed around one-quarter of the state’s energy needs in the middle of the day as well.
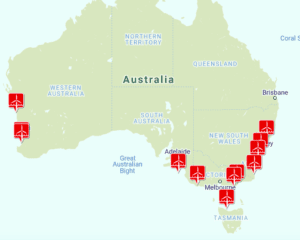
What is interesting to note is that one wind farm, the 270MW Collgar wind farm near Merredin, which was Australia’s largest until the opening of the Macarthur wind farm in Victoria this year, accounted for more than 12 per cent of the state’s energy needs for most of the night, peaking at around 12.8 per cent soon after midnight.