Tasmania’s switch back to fossil fuels has been one of the major talking points of this web-site, and the Australian energy industry over the past few months.
As we have documented, Tasmania – once the only state to be able to boast a 100 per cent renewable energy supply – has fallen to little more than 50 per cent renewables after a drop in dam levels to record low levels forced it to curtail its generation of hydro power.
Its plans to supplement its power needs with imports from Victoria (mostly brown coal generation) were stymied when the cable to the mainland broke in late December, forcing the island state to switch back on its main gas generator, and add up to 200MW of diesel.
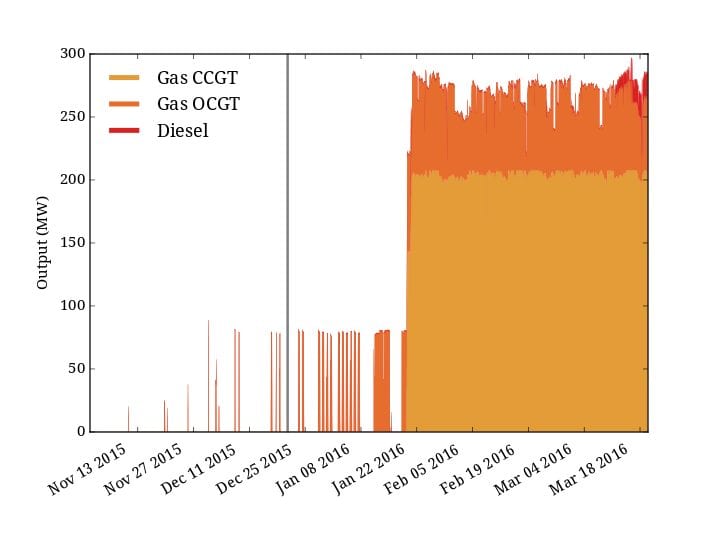
These graphs, courtesy of Dylan McConnell and the team from the Melbourne Energy Institute, highlight that massive switch back to fossil fuels.
The first shows only local fossil fuel generation, with a few bouts of peaking plant (gas OCGT , or open cycle gas generation) before the New Year, followed by large amounts of its Tamar Valley combined cycle gas plant, and supplemented by open cycle or peaking gas.
This has largely been responsible for the surge in wholesale electricity prices to around $260/MWh to $300/MWh – compared with Tasmania’s normal prices of around $40/MWh.
Last week, the first of the 200MW of diesel plants was switched on, the 24MW Catagunya diesel generator. Another two diesel plants should start producing soon: the Meadowbank diesel generator (also 24MW), and the George Town Diesel Generator (30MW). These will likely push prices even higher.
This next graph shows all Tasmanian generation – before and after the loss of BassLink. The loss of the cable forced Hydro Tasmania to quickly lift its hydro output, despite falling dam levels, and then to switch on the gas and diesel generators. The 310MW of wind generation, in green, has remained consistent with capacity factors of between 35 per cent and 39.5 per cent from the two major wind farms, Woolnorth and Musselroe, according to separate data from Green Energy Markets.


