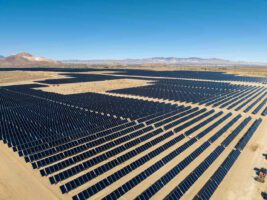
Here’s another interesting graph showing the growing impact of rooftop solar PV in Australia. In South Australia, the state with the highest penetration of rooftop solar in the country, rooftop solar PV probably contributed more than 20 per cent of the state’s demand between the hours of noon and 4pm on Sunday. As this graph taken from the APVI’s Solar Map shows us.

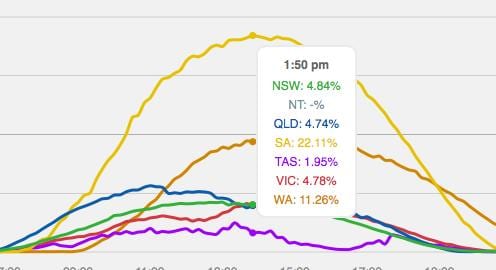
Last week, we noted how three states had sources at least 10 per cent of the demand from rooftop solar for large parts of the day. Today’s graph from the APVI’s solar map shows that in South Australia, at least 20 per cent of the state’s demand came from rooftop solar PV, for a large part of the day, with a peak output of more than 22 per cent just before 2pm. Rooftop solar supplied more than 10 per cent of the state’s demand between the hours of 9am and 5pm.
Here’s another view of what happened in SA.