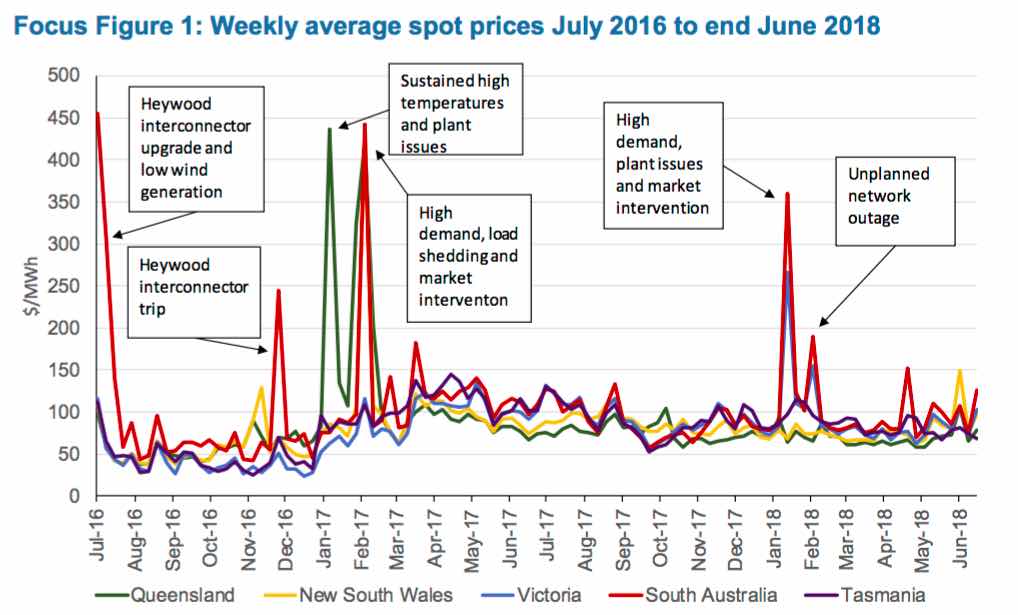
This graph caught our eye. It comes from one of the regular weekly updates from the Australian Energy Regulator, but this one summarises some of the major events over the past two years.
In the graph above, the AER has tracked the major price spikes across the National Energy Market – and please note that these are weekly prices, rather than prices that reflect the normal half-hour settlement period. So no $14,200 prices here.
The causes outlined by the AER are pretty clear – mostly a mixture of plant problems (read, failing coal or gas generators), network faults, and high demand associated with high temperatures in summer. The lack of wind was mentioned once.
This next table is interesting too. We are taught to expect increased volatility as the share of renewables increases, but this table tells us otherwise.
Over the last year, the number of price spikes has fallen dramatically, possibly because of the increased scrutiny on bidding behaviour of the big generation companies, particularly in markets with little competition such as South Australia and Queensland.
South Australia remains the most volatile electricity market, as it has always been, but coal dependent Queensland (7 per cent renewables) and NSW also had high volatility.
Queensland’s was significantly reduced after the state government told its state-owned generators to pull their heads in, and while the number of price spikes also fell in NSW, it wasn’t far behind South Australia.
Even Victoria had less volatility in the first full year after the closure of Hazelwood.
This next one summarises the average prices – showing that all states except Victoria and Tasmania experienced falls in average spot prices. Victoria, because more expensive gas and more costly black coal in NSW played a greater role.
And finally, the AER notes, the market price cap for wholesale markets has risen to $14,500/MWh from $14,200/MWh.

