Global-Roam and Greenview Strategic Consulting collaborated together recently to publish the Generator Insights 2021 report, taking a deep dive into historical generation performance across the NEM and considering what this means for the future.
In this article I’m sharing some highlights around the increasing penetration of large-scale wind and solar generation, including historical changes in time-of-day earning patterns, the increasing importance of forecasting of renewable output, and some longer-term challenges.
Falling revenues at lunchtime
The NEM – including when the money is made – is changing. The share of renewable energy (including large-scale wind and solar, hydro and rooftop PV) in the NEM has risen from 14% at the start of 2017 to around 35% at September 2021, and with it, we see a widening difference in the relative value of generation in the evening peak compared to at midday.
It’s not just the headline average market price for a region (the time-weighted average) that’s of interest to generators. GenInsights21 calculates a GWA (Generation-Weighted) average price across generator types and compares this to the time-weighted average (what a flat-output generator would earn), finding that the discount seen by solar generators in particular has increased since 2018. This table comes from Appendix 25 (of the 28 Appendices included):

This is a somewhat predictable outcome from increasing penetration of solar farms – that the value of solar generation will fall as the sun shines at approximately the same time across a region – but it’s worth having a detailed look, as GenInsights21 does, at what’s happening across the day.
The chart below shows spot revenue per MW of capacity across different generation types and time of day, for four years (with 2021 up to end-September). The dark purple is the 2021 data, showing the middle of the day dipping lower in value especially for solar farms, and the evening peak increasing in relative contribution to a plant’s revenue, which the wind farms are capturing but solar aren’t.
Running an hour or two later in the evening (for example with some storage) could make a large difference to a solar farm’s revenue.

You only have to look at the example of what happened in the Queensland region last week, with solar farms just missing the prize, to see a significant example of this.
Complexity is up – and wind and solar farms are getting involved
Our analysis shows that forecasting of wind and solar generation is becoming more important to the secure operation of the NEM, and that semi-scheduled (large renewable) plant are becoming more active participants in the market through self-forecasting and auto-bidding.
Increasing dependence on forecasting
One of the key challenges for the NEM identified in the GenInsights21 report is that variability and uncertainty are increasing, given the increasing weather dependence of supply and demand for electricity, and so the market is becoming more reliant on forecasting.
I’ll focus here on wind and solar forecasting in short-term timescales, covering the day-ahead and five-minute-ahead dispatch.
Day-ahead forecasts
The NEM is an energy-only self-commitment market, meaning that generation with slow ramping and/or energy limitations makes its own decisions about when to make itself available to generate. Critical inputs to this decision making include AEMO’s pre-dispatch forecasts (up to a day and a half ahead) of prices and demand for each region.
The quality of these pre-dispatch forecasts depends on the forward forecasts of wind and solar generation, currently prepared by AEMO’s AWEFS and ASEFS forecasting systems. In GenInsights21 we investigated how well these forecasts performed, looking at the availability among other measures. The availability is the forecast of the output the generator would produce if dispatched to run without limit.
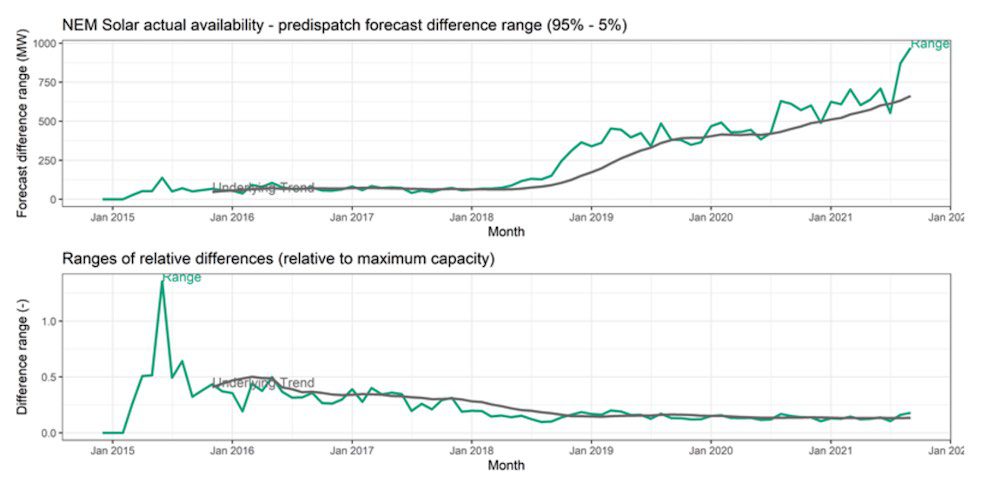
The graphs below show the spread of difference across a month between the 24-hour-ahead forecast and the dispatch forecast, aggregating all units – from Appendix 16. The top graph in each pair below shows the range in MW, while the lower graph shows the relative size of the range adjusted for the capacity of generation.
For wind, the top pair of charts below, while the forecast difference range is increasing with time (as more capacity is installed), the relative difference is falling, showing some benefit of diversity between the generators.
In the long‑term, our analysis of wind availability differences in the NEM suggests the magnitude of the 90% range is proportional to the square root of maximum capacity. Applying this relationship to future projections of wind capacity, we expect increases in capacity to result in weaker increases in aggregate forecast uncertainty.

In the solar charts below, the trend in the 90% difference range has increased in conjunction with increases in installed capacity across the NEM. Relative to maximum capacity, the 90% range remains steady. This suggests that forecast availability differences among solar generators in the NEM may be more correlated than wind availability differences.
Note that the Sep 2021 point is anomalous due to constraints that limited inverter enablement at several farms being visible in the dispatch availability (the “actual” here) but not the pre-dispatch forecast availability figure, which while affecting our forecast evaluation here, would have had no practical impact on the accuracy of the pre-dispatch outcomes.
Real-time delivery to forecast
The charts above looked at day-ahead forecasting up to the last forecast of generator availability. The next question is whether the wind and solar farms delivered what was forecast.
One measure of this is “Raw Off-Target”, which we calculate as the dispatch target (what AEMO thinks the generator will do) compared to what it actually generated at the end of the dispatch interval – also taking into account any Regulation FCAS enablement allowances.
It’s expected that there will be some uncertainty in the output of wind and solar farms given the uncertain fuel inputs, and the NEM can manage small deviations through existing FCAS services, but larger deviations (especially above 300 MW) can be risky to power system security.
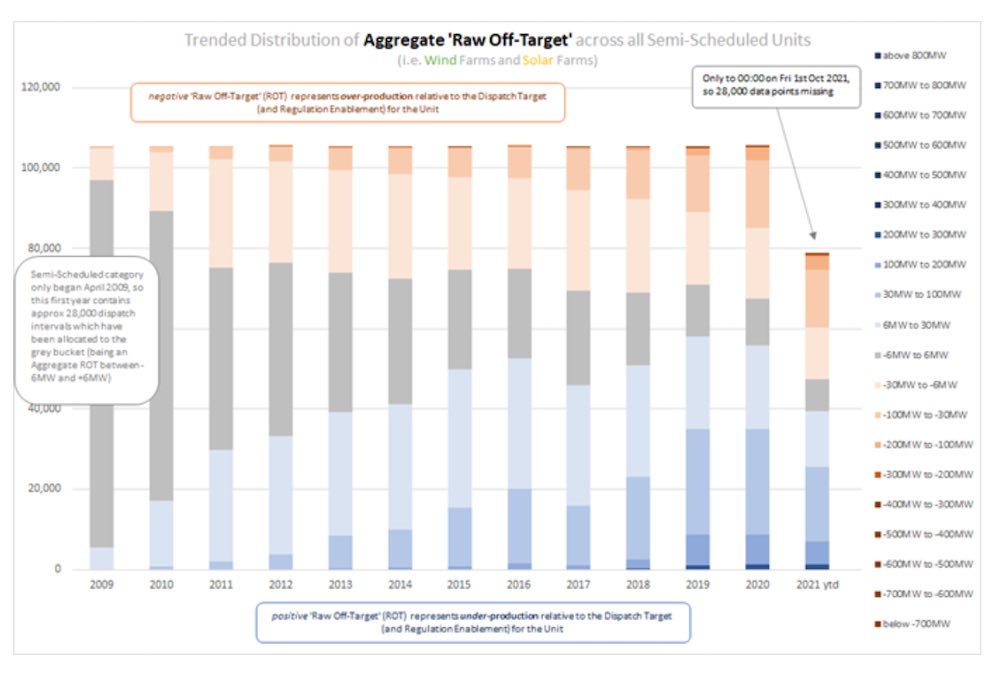
This chart below shows the aggregate off-target across semi-scheduled units (wind and solar farms that receive a dispatch instruction from AEMO), where a positive is under-generation and negative is over-generation – from Appendix 17.
This is calculated in aggregate across all the semi-scheduled generators, so allows some over- and under-generation to cancel out. The darker colours indicate intervals where large deviations were seen. In the last few years it’s clear that there are fewer intervals with very low off-target, and many more in the 100-200 MW range, plus increasing incidence of higher-deviation intervals.
Self-forecasting
Wind and solar generators are now able to provide their own self-forecast to AEMO for the dispatch (5-minute-ahead) forecast, instead of AEMO’s AWEFS/ASEFS forecast. The first self-forecast used in dispatch was Tailem Bend solar farm in September 2019. The idea is that wind and solar farms have better information than AEMO on the local conditions and plant status and should be able to make better 5-minute-ahead predictions.
More accurate dispatch forecasts would improve the aggregate off-target numbers shown above. In GenInsights21 we looked at the uptake of self-forecasting across wind and solar farms, finding that as at the end of September 2021 around 50% of solar farms and 40% of wind farms were using self-forecasting – from Appendix 6.

Auto-bidding
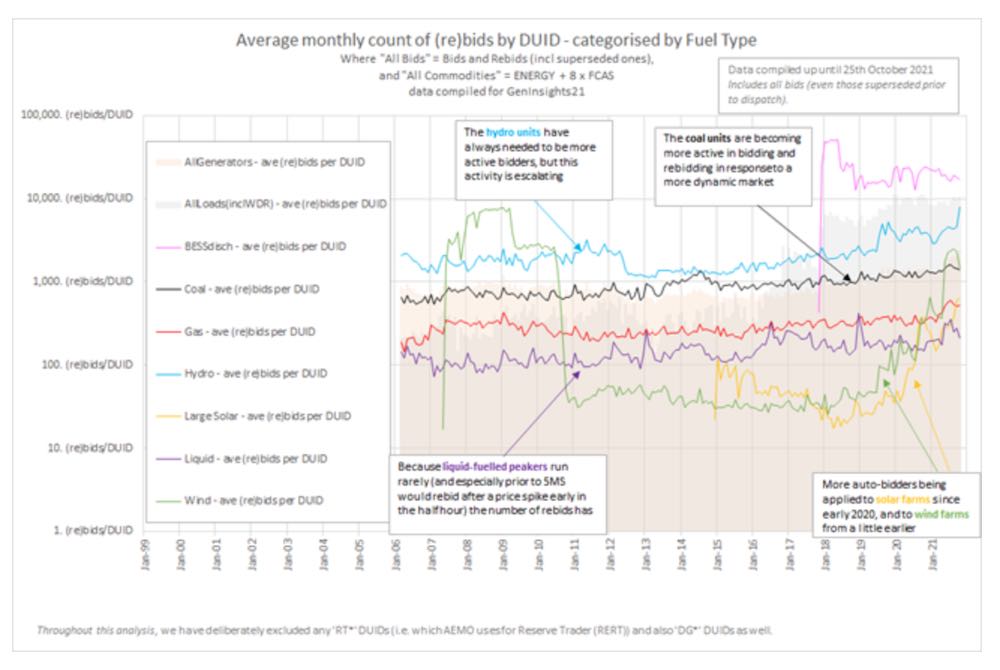
With increasing incidence of negative pricing and constraints, wind and solar farms are needing to be more sophisticated in their bidding strategies. In GenInsights21 we charted the number of rebids made by generation type, showing a large uptick in the number of rebids made by wind and solar in the last two years – from Appendix 22. Note that this is a log-scale chart!
We also tabulated our estimates from public data of which generators are using auto-bidders, and where we could tell, which auto-bidding supplier was used.
Other challenges towards 100% renewables
What is meant by 100% renewables?
We have Appendix 26 in GenInsights21 that tries to untangle what’s meant by this – with one major distinction being between instantaneous or sustained 100% renewables.
Getting to zero-thermal
In July 2021 AEMO’s new CEO Daniel Westerman talked about a 100% instantaneous renewables scenario by 2025. GenInsights21 considered some of the major barriers, finding that there would likely at current installation rates be sufficient renewable capacity to meet this goal, in the right conditions (remember this is instantaneous, not sustained), but that getting the thermal units down to zero would be a much harder proposition.
Challenges to reach zero-thermal include the need for system security services such as inertia and system strength, the current low participation in FCAS provision by wind and solar, and the limited ramping capabilities of thermal plant (to come back up as the renewables came off).
Wind drought
Considering the concept of 100% sustained renewables (or somewhere near it), GenInsights21 Appendix 27 analyses historical wind speed data at hundreds of weather stations across the NEM to find the prevalence of “wind drought” periods, similar to June 2017 where some wind farms generated a third of their median generation for the month.
There were two other “droughts” identified in the past 15 years, in July 2006 and May 2010, where our estimated 30-day average capacity factor (for hypothetical wind farms) was similar to that of June 2017.
This article was originally published by Watt Clarity. Reproduced here with permission