Direct action: Every solar module adds to emissions freefall

The Conversation

For more than a decade, climate science has been flagging the need to greatly reduce greenhouse gas (GHG) emissions. To avoid the possibility of serious and irreversible global warming, climate science is telling us we need to reduce emissions by some 80% by 2050.

Said like that – “80% by 2050” – the challenge seems highly improbable. It may well prove to be. Despite the best wisdom of several decades of science, global GHG-emissions continue to increase at or above trend (about 2%).

The huge investment in the infrastructure that serves our current energy needs and contributes to the bulk of those emissions has invested a substantial interest in the status quo with some very powerful players, including governments. And then there is the issue of adding another 1-2 billion people to a global population that is already short on adequate energy services.

But another way of looking at the problem, year-by-year, sector-by-sector, can help to make the challenge seem a little less daunting. A focus on a yearly reduction target of 4% seems a little more manageable than the equivalent “80% by 2050”. For one thing, it allows us to assess what is working now, and what is not, and why.

With that 4% in mind it might come as something of a surprise that one sector that is doing its bit is the Australian electricity sector. And the reason is largely about direct action – if you’ll excuse the pun.

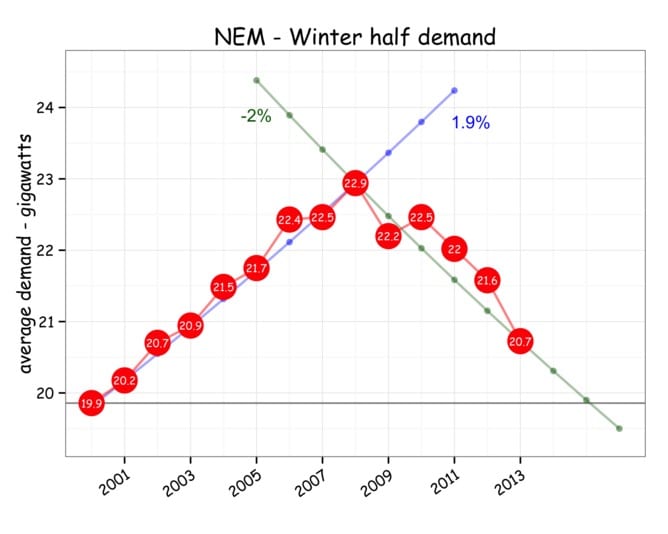
To illustrate why we can refer to the figures below, that show both the trend in demand for electricity served during the six-month winter period on the National Electricity Market (NEM) and the trend in GHG-emissions from the sector. (It doesn’t matter particularly that its the winter period, as the same is more-or-less true for any similar period). The data are from AEMO – the market operator.

The key point is that emissions from the Australian electricity generation have been in virtual freefall for five consecutive years, tracking downwards on the back of an unprecedented reduction in electricity demand.

NEM-wide electricity use (excluding Tasmania) for the six month period April through September, expressed as average electricity demand in gigawatts. Sourced from AEMO half hourly demand data.


NEM-wide GHG emissions for the six month period April through September, expressed as millions of tonnes of CO2-equivalent. Sourced from AEMO daily emissions data.


Since 2008, winter electricity demand has decreased 10% in real terms – at an annual rate of 2%. Emissions have fallen even faster – at an annual rate of 3.2%. Note that winter emissions are already below year 2000 levels. The sector is already on its way of smashing Australia’s bipartisan political target of 5% below year 2000 levels by 2020, by a whopping 6 years.

While there are a number of factors that are contributing to this dramatic emission reduction, the key underlying reason is the sensitivity of the most emissions-intensive (read coal-fired) generation to the ongoing imbalance in supply and demand.

Recent history shows that reductions in electricity demand give an emission reduction multiplier of about 160%, because the over-supply is being disproportionately absorbed by the most emission-intensive part of the electricity supply chain. In driving down demand we are also driving down emission intensity.

In effect, this nexus between demand reduction and emission intensity reduction is our free bonus. The key message is that if you want to get emissions down, then take a direct action by reducing electricity consumption and then watch the market do its thing.

Going the extra percent

Not withstanding the help provided by a high Australian dollar, low aluminium prices and the sluggish global economy, getting our electricity-sector emissions substantially into the negative has been relatively painless.

In the near-term it shouldn’t be very difficult to maintain the current rate of emission reduction, and increase it by an extra percentage point or so. There is still a significant energy efficiency dividend to play out.

While we have already reduced domestic demand significantly, well targeted efficiency measures could reduce it another 20% or so without significantly impacting the amenity provided by our energy use. With domestic demand contributing around a third of total demand, that would drive a further 10% reduction in electricity-sector emissions.

Distributed generation is clearly playing its role in reducing demand for centralised electricity services. With small-scale solar rapidly approaching grid parity, there is a growing incentive for deployments that will further reduce demand for grid-based services. That should provide another 10% or so of electricity-sector emission reduction in the near- to medium-term.

Further emission reduction will require replacement of the remaining coal-fired assets with much lower emissions technologies. While there is no shortage of alternatives, such as nuclear, renewables and gas, building any new generation at scale is fraught. With falling demand, and the market screaming “get rid of supply”, there will be little appetite for any significant new supply-side investment in the near-term.

One near-term option is to make more use of existing gas generation capacity. Historically, natural gas has been used to provide peaking capacity. So there is significant potential emissions benefit in making more use of the existing gas capacity at the expense of coal.

In effect, this scenario has been played out in the US in the last few years, resulting in quite a staggering nominal GHG-emission reduction (greater than 4% in 2012) on the back of a surge in unconventional gas production. Of course, an important caveat is that the new gas production is not leading to any significant increase in fugitive emissions. (In the US, the coal-to-gas transition has benefited by a decoupling of gas and oil prices. Worryingly, the most recent reports out of the EIA indicate that with US gas prices now rising again, there is already a switch back to coal, with 2013 electricity sector emissions already rising).

Beyond the decadal-timescale, driving emission reduction in the electricity sector will need an aggressive build out of zero-emission generation capacity using nuclear and/or renewables. Creating new demand through electrification of transport and a move away from domestic gas use should help provide renewed incentive for new build (as well as help drive emission reduction in the transport sector).

While it has been just five years, in just one sector, in just one country, the changes in the Australian electricity sector emissions since 2008 are quite phenomenal. They show how collective direct action can lead to the emissions freefall warranted by the best wisdom of science.

Comments

11 responses to “Direct action: Every solar module adds to emissions freefall”

  1. Warwick Avatar
    Warwick

    This article overstates the reduction in NEM wide energy consumption by a significant amount. It is really wrong to say “It doesn’t matter particularly that its the winter period, as the same is more-or-less true for any similar period). The data are from AEMO – the market operator.” as if you look annualised AEMO data for each of the 2008 periods (i.e 2007/8 195,317 GWh and 2008/09 with 197,198 GWh) against AEMO’s 2012-13 figure of 188,898GWh, the reduction is only 3.3% or 4.2% respectively i.e. much less than half the amount stated in the article (10%).

    There’s also some key things overlooked that distort these figures presented in the charts and the problem of cherrypicking winter with the mildest winter on record this year, issues at the Yallourn power station and the reduced output of hydro before the carbon price was implemented and the subsequent increase in hydro output under carbon pricing (which will likely again reduce under carbon pricing repeal) means that the emissions reductions may not necessarily be maintained in the future

    It’s also naive to think “In effect, this nexus between demand reduction and emission intensity reduction is our free bonus.” when much of this reduction has been subsidised through energy efficiency schemes, renewable energy schemes and the carbon price. This reduction in emissions is a good thing but appropriate scrutiny and honesty is required when assessing the cost of abatement which is why any scheme be it renewables, carbon pricing, energy efficiency or “direct action” needs to be costed appropriately.

    It’s far from clear why stationary energy emissions will continue to decline as you suggest, when the carbon price is likely to be repealed, making it cheaper for coal to pollute (and less attractive for hydro), the renewable target may be diluted, gas may face international pricing parity, there will be population growth and it is costly for peaking gas plants to convert to CCGT’s.

    I think the road to further emissions reduction is more costly and challenging than you propose..if only it were that simple.

    1. Jeremy Avatar
      Jeremy

      The road is simple, as most consumers are now aware of electricity price rises and are starting to think about they can cut costs. This is a cultural shift that will stay with us. I think you are nit-picking and are missing the clear trend that has been presented.

      1. Warwick Avatar
        Warwick

        Jeremy, it’s important to get the facts right. Sloppy analysis and drastically overstating the emissions reductions creates complacency, in much the same way that people have stopped signing up for additional greenpower as they think it is unnecessary due to carbon pricing and renewable targets.

        If it is so simple as you suggest, why have policies for climate change effectively scalped two prime ministers, why do websites such as this exist and why is there so much debate on renewable/carbon policies?

        1. Bob_Wallace Avatar
          Bob_Wallace

          I’d say most of the debate on renewable/carbon policies is fueled by fossil fuel interests trying to delay their extinction as long as possible.

          If we didn’t have a huge cloud of dust thrown up constantly by the fossil fuel industry people wouldn’t be confused by false claims and we’d be moving much rapidly toward grids powered by renewable energy.

        2. Mike Sandiford Avatar
          Mike Sandiford

          Dear Warrick,
          …at the risk of repeating myself…

          please note the comment in the first figure caption above – my demand figures are less Tasmania – the reason being that TAS only joined the NEM in 2005 and comparing long term trend-changes ( i.e. pre and post 2008) is complicated unless TAS data is not filtered out. I think this should alleviate your concerns. In response to your somewhat inflammatory remarks perhaps I could gently suggest that you take more care in reading what is written?

          FYI. I have rerun the numbers for the full year to the end of September.

          NEM demand has declined at an average 1.6% p.a. since 2008, for a total decline of 8% (again, excluding TAS).

          NEM emissions have declined at an average 3% p.a. since 2008 for a total decline of 15%.

          At around 185% the yearly average mulitiplier (emissions on demand) is even higher than for the winter half cited above. My contention is that it is this multiplier that is important in understanding our best near-term options in the absence of a carbon pricing mechanism.

          with regards
          Mike Sandiford

          P.S. I always enjoy your comments and the insights they bring, and yes I do recognise other matters have impacted such as the breaking of the Millenium drought (which has boosted Hydro contribution at expense of coal), as indicated on my other pieces on the The Conversation web site such as http://theconversation.com/how-broken-is-the-governments-carbon-pricing-mechanism-16442

    2. RobS Avatar
      RobS

      I disagree Warwick, the major price signals which now favor solar and wind over coal are largely unrelated to Carbon pricing. New Coal is both politically and financially a non-starter and with a coal power plant fleet with an average age around 35 years Nothing short of huge subsidies to build new coal power plants will stop a rapid decline in coal power production. Simultaneously Solar’s reaching unsubsidised retail grid parity will see an inflection point of rapid growth in solar installations. Those factors are independent of carbon pricing, RET and other manipulable factors. I don’t think either side of politics has the stomach for mass fossil fuel subsidies, the worst we can expect is the removal of remaining solar subsidies which are now so tiny as to be insignificant when compared with the pricing incentive to go solar. The advent of afforadable grid balancing storage will be the final nail in the coffin of fossil fuel generators and the traditional centralised grid model.

    3. Mike Sandiford Avatar
      Mike Sandiford

      Dear Warrick,

      please note the comment in the first figure caption above – my demand figures are less Tasmania – the reason being that TAS only joined the NEM in 2005 and comparing long term trend-changes ( i.e. pre and post 2008) is complicated unless TAS data is not filtered out. I think this should alleviate your concerns. In response to your somewhat inflammatory remarks perhaps I could gently suggest that you take more care in reading what is written?

      FYI. I have rerun the numbers for the full year to the end of September.

      NEM demand has declined at an average 1.6% p.a. since 2008, for a total decline of 8% (again, excluding TAS).

      NEM emissions have declined at an average 3% p.a. since 2008 for a total decline of 15%.

      At around 185% the yearly average mulitiplier (emissions on demand) is even higher than for the winter half cited above. My contention is that it is this multiplier that is important in understanding our best near-term options in the absence of a carbon pricing mechanism.

      with regards
      Mike Sandiford

      P.S. I always enjoy your comments and the insights they bring, and yes I do recognise other matters have impacted such as the breaking of the Millenium drought (which has boosted Hydro contribution at expense of coal), as indicated on my other pieces on the The Conversation web site such as http://theconversation.com/how-broken-is-the-governments-carbon-pricing-mechanism-16442

      1. Warwick Avatar
        Warwick

        Hi Mike, I’m sorry you feel my comments are inflammatory (which I fund puzzling as they are by no means of a personal nature). My criticisms are of the shortcuts in your work and your approach in reaching premature conclusions as it needs appropriate thoroughness and academic rigour (I notice you misspelt my name twice today). I see you’re trying to encourage emissions reductions which is good, but you need to get your facts right.

        Addressing your reply… you can’t really exclude Tasmania since Basslink was introduced in 2006. i.e. AEMO provides emissions data per region which would make your analysis valid ONLY if there were no flows between Tasmania and the mainland. This means that Tasmania will either import (therefore increasing your NEM emissions intensity figure) or export (which reduces the NEM emissions intensity) simply because you are not accounting for that production or consumption that flows across Basslink. To put it another way, your figures are only Mainland Emissions/Mainland consumption where imports of power are not adjusted for emissions and exports of power are not deducted for emissions (either of which is very difficult to calculate). (Note that if you are taking regional emissions data from AEMO, that at any time the emissions may be effectively for or from another region)

        I notice too that you quote “AEMO half-hourly data”, which I assume you mean REGIONDEMAND from the dispatch tables…this is also a problem as these figures are effectively the aggregate dispatch targets net of interconnector flows in each of the regional reference nodes and not the actual energy consumption. AEMO actually uses more accurate data from the bulk supply networks in preparation of its Electricity Statement Of Opportunity (http://www.aemo.com.au/Electricity/Planning/Electricity-Statement-of-Opportunities) …Have a look at figure 1 for the 2013 ESOO data and you will see where to get accurate data from (which is the figures I quoted earlier). It’s not simple to get the real and accurate data which is why there is a delay post settlement. I think you’ll understand that I’ll rely on AEMO’s data over yours and trust that you’ll adjust your calculations accordingly.

        I’m doubtful about your 185% multiplier not just for the reasons cited above but assuming that there’s a straight line relationship in each case just like the charts which I notice seem to always have a very steep slope by choosing the some of the most favourable points (you could at least do an OLS regression!) I noticed you had criticised NEMMCO/AEMO’s forecasts because they assumed long term growth of around 2% year on year and now you are telling us from your charts that you expect energy consumption to decline by around 2% a year.

        Anyway, if you’re really interested in being thorough, I’d be happy to contact you in person and assist you to get some of your data assumptions correct.

        1. Mike Sandiford Avatar
          Mike Sandiford

          Dear Warwick (with apologies for the misspelling).

          You are always welcome to visit.

          I acknowledge that AEMO publishes a range of different measures of electricity demand/useage. However the only readily accessible long-term records (ie over the lifetime of the NEM) are the Aggregated Price and Demand Data Files data in which the Total Demand is reported at half hourly intervals in each region. Given this, it would be very concerning if the published aggregated half hourly data were so out of kilter with reality, as you suggest. (I understand the Total Demand figures include auxiliary loads, transmission losses and interconnector imports whereas the data you cite from ESOO are consumption based).

          Interestingly my analysis of the multiplier is not much different to what can be inferred from Hugh Saddler’s commentary published on the same day (https://reneweconomy.wpengine.com/2013/australia-power-demand-falls-again-as-sa-stays-30-green-49800 – annual demand down 7%, emissions down 16% from the peaks in 2008 giving a multiplier in excess of 200%).

          Finally, It’s worth noting that comparisons using winter intervals provide a sharp insight into the post GFC decline, because the impact of the GFC only really kicked in early in 2009 in the autumn season. With winter demand peaking in 2008, the winter intervals now give us 5 years to evaluate the subsequent declining demand. Since the summer season (Dec 2008-Feb 2009), there have been only 3 seasons out of 18 that have seen Total Demand increase – as reported by AEMO – compared to the year before (https://theconversation.com/the-great-de-electrification-16687)

          Mike

  2. Bob_Wallace Avatar
    Bob_Wallace

    2050 is almost 40 years away. The average life of a coal plant in the US is 39 years. I would suspect that only a small percentage of current fossil fuel plants around the world will still be in use 40 years from now.

    Those worn out plants will need to be replaced with something. Replacement cost is already baked in. What we have to do to hit the 2050 target is to replace fossil fuel plants with renewable generation and except for early thermal plant closure that money is money that would be spent in any case.

    The same is true with vehicles. The personal vehicle fleet will turn over 2-3 times in the next 40 years. If we can get affordable, higher capacity batteries in place in the next 10 years there should be almost no gasmobiles left on our roads by 2050. Again, here’s another place that we transition off fossil fuels for no real cost. We simply buy something different than what we used to when we make our scheduled purchases.

    Then there’s efficiency. Some projections are that efficiency will cut demand in the US between 10% and 20% by 2020. A 20% drop in demand means that we can turn off half our coal plants. No need to replace them. Their output will not be needed. The money that would have been used to replace coal plants can be put to some other use.

    And we’ll get some of that efficiency by simply replacing the stuff we would replace anyway with more efficient stuff. Incandescent bulbs burn out quickly. Going forward they will be replaced with very long life LEDs, saving bulb cost and electricity – money. Desktops have been largely replaced with much more efficient laptops and those, in turn are being replaced with even more efficient tablets. Over the next 40 years pretty much every air conditioner, refrigerator, clothes washer and other appliance will be replaced one or more times. We’ll keep making them more efficient.

    If we’ve got until 2050 I think we’ll be fine….

    1. Chris Fraser Avatar
      Chris Fraser

      There’s also small irony in that upward retail energy price pressure (from over investment in poles and wires) will also drive investment in technology improvement like the coefficient of performance in aircon systems and energy densities of batteries. I can imagine this regime will be most punishing on emissions intensive energy.

Get up to 3 quotes from pre-vetted solar (and battery) installers.