− Spot electricity prices were stronger than the previous corresponding period (pcp) but down on last week in most States. Prices in Victoria were the surprise, averaging over $70/MWh. The biggest relative winner is likely Sunset Power, which last November bought Vales Point station in NSW for $1, yep just $1. NSW pool prices would be up 50% since then and not all the output hedge. (See below for more)
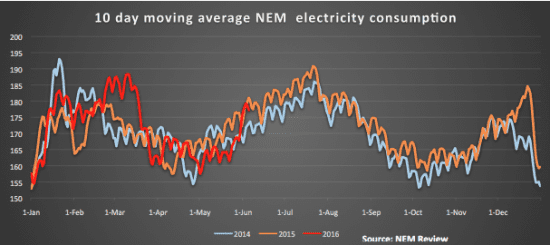
− Volumes in NSW were down on the week and month but remain 1% up for the calendar year to date. Volumes in Victoria were unchanged on last year which means that the change in price is due to either change in bidding behavior, a flow on from the interconnect from Tasmania being down, or the marginal impact of more volumes to South Australia or NSW. We looked at the net outflows from Victoria (to NSW and South Australia and from Tasmania) for the 30 days ended 12 June in 2016 and 2015 and found them on balance little changed (See Fig 14). So demand is unchanged, flow is unchanged but prices are strongly up!
− Futures prices were basically flat
− REC prices were flat and little trading.
− Gas prices were up in year on year terms in QLD but actually down in NSW and South Australia
− The ERM, IFN and ORE share prices were particularly strong but the market took a breather where RFX and GNX were concerned.

Share prices
The best performer during the week was Energy World, a small cap stock that provides electricity broking services to commercial and industrial companies. IFN and ORE once again had as strong week and EPW (the third largest retailer by volume in Australia) shares were up 10%. Most utility stocks outperformed the broad index over the week but “investors” in two of the “hotter” micro caps, Redflow and Genex took a breather this week. We want to emphasize that the big week to week movements in the small stocks are of interest but so are the small, lower risk returns in the larger stocks such as AGL, APA, AST, DUE and SKI that don’t look so dramatic on these charts.


Volumes
The volume picture didn’t change much. NSW volumes were down for the week and the month compared to PCP, probably due to relatively warm start to June but NEM volumes remain up 1% compared to PCP and even Victorian volumes are now flat. The impact of the closure of the Point Henry Aluminium smelter now seems to have washed out of the comparisons. There remains no news on the outlook for the Portland smelter, and if there is going to be some news we would expect it over the next couple of months. The new electricity contract and price for that smelter starts in November this year we think and if it were to close some advance notice would be required.

Base load futures
Baseload futures had a quiet week with the FY17 numbers down 1% compared to last week in a couple of States.


Spot prices absurd average over $140 MWh for the week in NSW
Spot prices remain very high across the NEM but its difficult to pin down the exact reason: there is a bit more demand in QLD, less gas generation and the closure of the Northern Power Station as well as Bass link being out.
Still we can’t help thinking that the increasingly vertically integrated nature of the market is also something to be considered. Probably the biggest relative winner out of the higher NSW prices are the owners of Sunset Power.
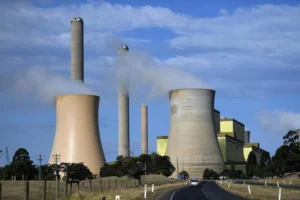
That company bought the Vales Point power station in November 2015 for $1. Yes you read that right, $1. Power prices in NSW are up 50% and not all the output would be hedged. This shows that there will be many winners and losers as we move to the renewable economy. That’s good news for Vales Point and while there will eventually be a clean up liability, for the time being the owners including Trevor St Baker will be having a quiet chuckle at how well this deal is going.
Gas prices in Qld moving up
Gas prices in Adelaide and Sydney were lower this week than last. Prices at the moment are really only changing a little more than seasonally expected with the exception of Brisbane, where last year’s $1 GJ isn’t expected to be seen again anytime soon.


David Leitch is principal of ITK. He was formerly a Utility Analyst for leading investment banks over the past 30 years. The views expressed are his own. Please note our new section, Energy Markets, which will include analysis from Leitch on the energy markets and broader energy issues. And also note our live generation widget, and the APVI solar contribution.


