Home » Policy & Planning » The crazy climate records from 2016 you haven’t heard much about

The crazy climate records from 2016 you haven’t heard much about

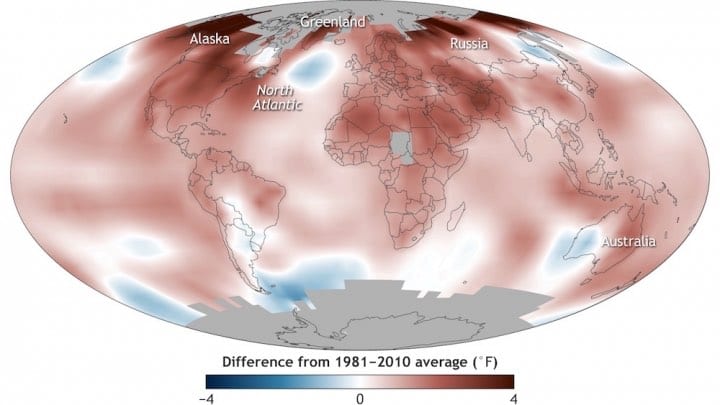
Global surface temperature in 2016 compared to the 1981-2010 average.
Credit: NOAA

Climate Central

By now, we’ve all heard that 2016 was the hottest year on record, and that heat-trapping greenhouse gases hit their highest concentration ever, surpassing 400 parts per million for the first time in nearly 1 million years.

Global surface temperature in 2016 compared to the 1981-2010 average. Credit: NOAA
Global surface temperature in 2016 compared to the 1981-2010 average.
Credit: NOAA

But there are other climate change-related records that have flown more under the radar. Several of those records were highlighted Thursday in the annual State of the Climate report, released in the Bulletin of the American Meteorological Society:

For example, during August, ice-free areas of the Barents Sea (north of Norway and Russia) were up to 20°F (11°C) above average, a figure that stunned climate scientists.

The Chukchi Sea off Alaska and the waters to the west of Greenland were 13°F to 14°F above average. Those warm waters were linked to the smallest annual winter peak in sea ice levels and the second lowest annual minimum.

The average land surface temperature for the Arctic was 3.6°F (2.0°C) above the 1981-2010 average — a 6.3°F (3.5°C) rise in temperatures since 1900. Record-high temperatures were measured below the surface of the permafrost, or permanently frozen ground, across the North Slope of Alaska.

Glacier mass balance — the difference between ice lost through melting and ice gained through new snowfall — each year since 1980 (blue bars) for the 44 glaciers in the World Glacier Monitoring Service’s reference network. The orange lines shows the running total ice mass loss between 1980–2015. These glaciers have lost the equivalent of cutting a 70-foot thick slice off the top of the average glacier. Credit: NOAA
Glacier mass balance — the difference between ice lost through melting and ice gained through new snowfall — each year since 1980 (blue bars) for the 44 glaciers in the World Glacier Monitoring Service’s reference network. The orange lines shows the running total ice mass loss between 1980–2015. These glaciers have lost the equivalent of cutting a 70-foot thick slice off the top of the average glacier.
Credit: NOAA

“2016 was a year in the Arctic like we’ve never seen before,” Jeremy Mathis, director of the National Oceanic and Atmospheric Administration’s Arctic research program and an author of the report, said.

The rate of warming in the Arctic, which is happening at twice the rate of the rest of the globe, has major impacts on local ecosystems, but also further drives the warming of the planet, as the sea ice that would reflect the sun’s rays back to space is lost.

And for the 37th consecutive year, alpine glaciers retreated across the globe. These glaciers are a major source of water for local communities, and their loss has led to concerns about water security, particularly in places like Southeast Asia.

Global surface temperature in 2016 compared to the 1981-2010 average. Credit: NOAA
Global surface temperature in 2016 compared to the 1981-2010 average.
Credit: NOAA


Source: Climate Central. Reproduced with permission.

Comments

5 responses to “The crazy climate records from 2016 you haven’t heard much about”

  1. Joe Avatar
    Joe

    I am sure the ‘Deniers’ will say its all a hoax or manipulation of measurements but… The Facts… speak for themselves. I love it when the Deniers change tack and say that CO2 is plant food and the extra CO2 is a booster for agriculture….ha,ha,ha.

    1. John McKeon Avatar
      John McKeon

      From amongst the Deniers: “It’s not happening”, “It’s not us”, “It’s not serious”. I wish they would make up their minds.

      1. Ren Stimpy Avatar
        Ren Stimpy

        There’s has to be a line. What is deniable and what is not.

        What is not deniable is the regression of the glaciers in the Himalayas, which is a regression in the source of irrigation for food crops that supply billions of Asians with food.

        We WILL have a carbon price within ten short years. It’s almost certain. The big energy retailers here are quite correct to say they will not build any further coal stations. Let this stupid government beat itself against a rock if that’s what they want to do.

        1. Joe Avatar
          Joe

          …that would be beating itself against that ‘Little Black Wonder Rock’, yes.The COALition are in love with that little black rock. Gee, why don’t they change The Marriage Act to legalise their love affair with Coal. As much as they’d love to build new Coalers they probably won’t be in Govt. after the next election to actually build any and it is only The COALition talking up building new Coalers. At the same time HELE’s, CLEEEEEEN Coal, CCS will all be fully exposed to the punters as a Hoax and Fake news.

  2. RobSa Avatar

    The current average for Brisbane forecast maximum temperature over the next week is 26.4°C. This is 5.4° above average. The worst case scenario suggests a global average rise of 8° by 2100. I believe we will be there around 2050 and that there will be hell to pay.

    Australia has a very hot centre that will bake our coasts as they grapple with the sea level rise of up to 2.5 meters much earlier than 2100.
    https://uploads.disquscdn.com/images/3c2d3c424a1ac606b77be77513f97c30c3062cc1a442978698de7650880dbd43.gif

Get up to 3 quotes from pre-vetted solar (and battery) installers.