(This is an excerpt from The Australia Institute’s monthly National Energy Emissions Audit: Electricity Update, August 2017).
The July 2017 issue of NEEA Electricity Update examined the contribution of rising wholesale prices to the retail price increases now being seen by consumers across the NEM. In this issue we go back a few years to look at the contribution of increases in the network (transmission and distribution) component of costs.
These cost components are the largest contributor to prices for all except very large industrial consumers, though wholesale prices are now catching up.
Prior to this year, network costs were by far the largest contributor to the dramatic increase in electricity prices.
In the 2016 edition of the AEMC’s annual Residential Electricity Price Trends report it was estimated that transmission and distribution costs accounted for the following part of the total price paid for electricity by a representative average residential consumer during 2016-17:

These shares have, however, varied somewhat in both absolute and relative terms in past years.
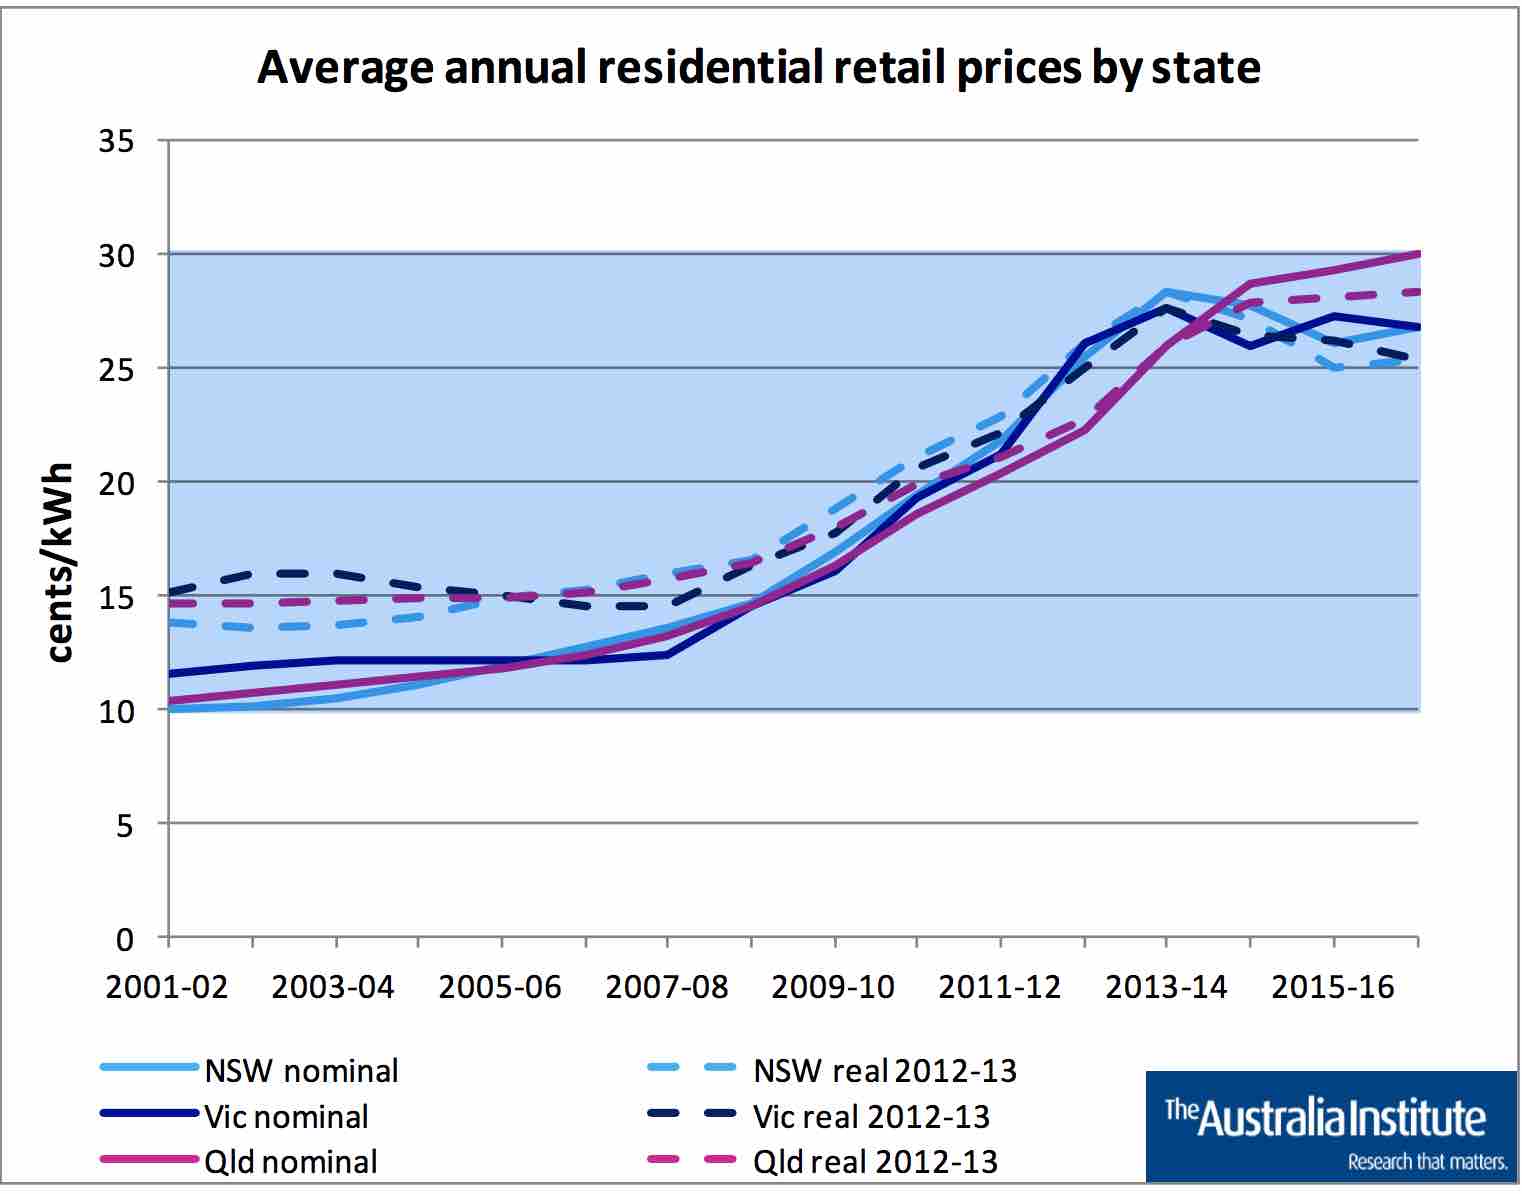
Figure 4 shows how average residential electricity prices have changed since 2002 in the three largest NEM states, expressed in both nominal dollars (of the day) and real 2012-13 dollars. Prices increased somewhat faster in Queensland and NSW than in Victoria.
Figure 4

Figure 5

Figure 6

Figures 5 and 6 show, in absolute and relative terms respectively, the average revenue, per MWh supplied, received by distribution network businesses from residential consumers, in each state and each year since 2006.
The Figures show that distribution network business revenues have increased much faster that total prices.
Hence, network costs have not only increased as a share of total price, but also have been the main factor causing the price increases.
Note that revenue received by distribution network businesses does not align exactly with the estimated network cost component of prices shown in Figure 4, because revenue also includes other components, notably the fixed daily connection charge.

Figures 7 and 8 show the total combined annual revenue received from all consumers (residential and business) by both distribution network business in each state (which account for between 70% and 80% of the total revenue) and transmission businesses.
It can be seen that, firstly, the rate of increase is much the same as the increase in revenue received from residential consumers alone and, secondly, that revenue of the businesses in NSW and Queensland is considerably higher than the revenue of the businesses in other states, and also increased much faster, particularly over the years from 2010 and 2013.
Revenue received by network businesses is used to cover their operating costs and also to service the capital which they invest. Figure 9 shows total key trend data since 2006 for the four NSW network businesses – Transgrid (transmission), and Ausgrid, Endeavour Energy and Essential Energy (distribution).
Revenue and expenditure are expressed in real dollars, whereas the data in Figures 7 and 8 are in nominal dollars, which is why growth in expenditure and revenue appears slightly slower in Figure 9.
The Figure shows that annual operating expenditure increased by a factor of about 1.4 between 2006 and 2012, while annual capital expenditure more than doubled over the same period.
By contrast, the quantity of electricity supplied to consumers over the whole year, measured in energy units (TWh), increased by less than 2% up to 2011, and since then has fallen away to be over 9% below the 2006 level.
The annual peak trading interval (30 minute) demand, measured in power units (MW), increased faster up to 2011, but since then has also fallen away.
In some years, including, most recently 2012 and 2015, peak demand in the NSW region of the NEM is higher in winter than in summer.
However, peak summer demand is usually more challenging for system operation, because the efficiency of both generation (including both thermal and renewable generation other than hydro) and transmission is lower at high ambient temperatures. For these reasons, forecast peak demand is a key driver of capital expenditure to increase supply capacity.
Figure 9

The most striking feature of Figure 9 is the change in the trend of both annual energy and peak demand after 2011, followed by a change in the trend of expenditure one year later. There is a further delay in the change of revenue, mainly because of the way the regulatory framework allows network businesses to earn a guaranteed rate of return on their total approved capital expenditure.
The total value of historic approved capital expenditure, net of depreciation, is termed the Regulatory Asset Base (RAB). In NSW this continued to increase up until 2014-15, because of the legacy of very high capital expenditure over the years up to 2012. Since return on investment accounts for more than half the total revenue of electricity network businesses (AER, State of the Energy Market May 2017, Figure 3.3), continuing high RAB means continuing high revenue and hence continuing high prices for electricity.
Why did capital investment increase so much during the period up to 2012?

The main reason is illustrated by Figures 10 and 11, which show annual electrical energy consumer and annual summer peak demand in each of the four mainland NEM regions (states).
The Figures show large gaps between actual and future annual peaks as projected by AEMO in its 2011 Statement of Opportunities document.
These expectations, combined with lack of institutional support for demand side measures which could have helped to reduce peak demand, allowed the network businesses to gain regulatory approval to make massive investments to increase supply capacity so as to be able to meet the projected extreme peaks.
As it happened, AEMO subsequently realised that demand has ceased to grow in mid 2010, and in March 2012 issued revised and much lower projections of future demand for electricity. By then, however, much of the approved expenditure on additional capacity had already been incurred by network businesses.
Comparison of Figures 10 and 11 shows that the 2011 projections of future peak demand increases were higher for NSW and Queensland than for Victoria and SA. This difference goes some way to explaining why network costs and revenues have increased faster in NSW and Queensland than, in particular, Victoria.
Unfortunately, the overwhelming majority of the excess investment was directed towards increasing the capacity of networks to deliver a one-way flow of electricity from large, centralised power stations to consumers.
At the time this investment was approved, distributed generation mainly took the form of industrial cogeneration, was not large and was hardly growing. Rooftop PV was negligible. That situation is now rapidly changing and distribution networks need to make new and different types of investment to allow two-way flow of electricity during the middle of the day in many parts of their networks.
However, the need for such investment will be significantly affected by how much battery capacity is installed on-site with rooftop PV system; more battery capacity will mean less need for network upgrades. How to ensure that necessary changes are made to networks, while avoiding the over-investment mistakes of the past, is one of the many challenges facing policy makers and the electricity industry today.
Finally, it will be noted that the downturn in network business revenue seen in Figures 7, 8 and 9 is not reflected in the network cost component of consumer prices for electricity.
This is largely a consequence of the steadily falling average demand per customer, occurring with both residential and business consumers. Residential consumption per customer fell, between 2009 and 2016, by 22% in Queensland, 17% in NSW, and around 15% in Victoria and SA.
What consumers ultimately require is not electricity per se, but the services which electricity can deliver. What ultimately matters to household budgets in not the price of each kWh of electricity purchased but the total annual cost of the electricity they have to buy to obtain the services they require.
Policy responses to high electricity prices should pay more attention to how consumers can be helped to use less electricity, by using it more efficiently to achieve the level of services they require.
Dr Hugh Saddler is


