Australia’s most coal dependent states missed out on the benefits of the growth in wind and solar in the December quarter, with wholesale prices in Queensland and NSW state grids at record highs and double that of their southern neighbours.
The latest Quarterly Energy Dynamics report from the Australian Energy Market Operator highlights a widening of the “north-side” divide, despite the lowest output of coal generation since the National Electricity Market was created, and the lowest amount of gas generation since 2004.
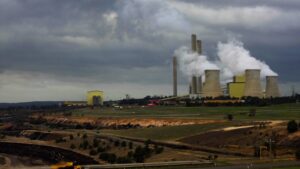
AEMO says the price spikes in the coal dependent states were largely because of widespread outages at ageing and increasingly unreliable coal plants, and significantly higher prices demanded by black coal generators, who shifted most of their output to prices well above $100/MWh.
So much so that the average price paid in Queensland in the December quarter was $120/MWh and in NSW it was $116/MWh, while in Victoria and South Australia it was around $63/MWh.
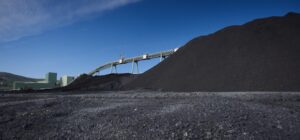
Coal output was cut to its lowest levels on record, and was hit hard by rooftop solar in the middle of the day, but when it did generate it demanded top dollar.

This graph above highlights the dramatic changes that have occurred in wholesale prices over the last few years, where higher levels of renewables have helped South Australia avoid the worst of the fossil fuel impacts, and Victoria also benefits from higher renewables and the fact that its brown coal generators are lower cost.
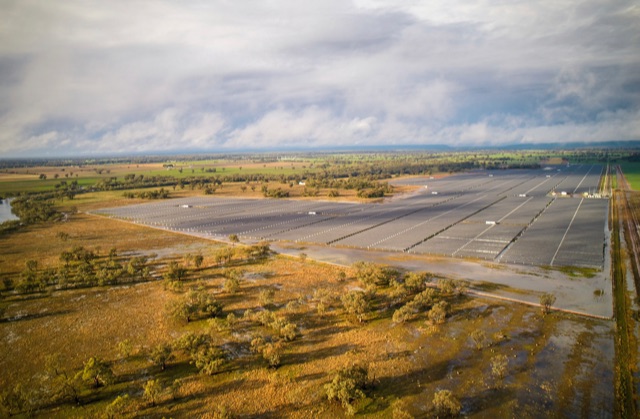
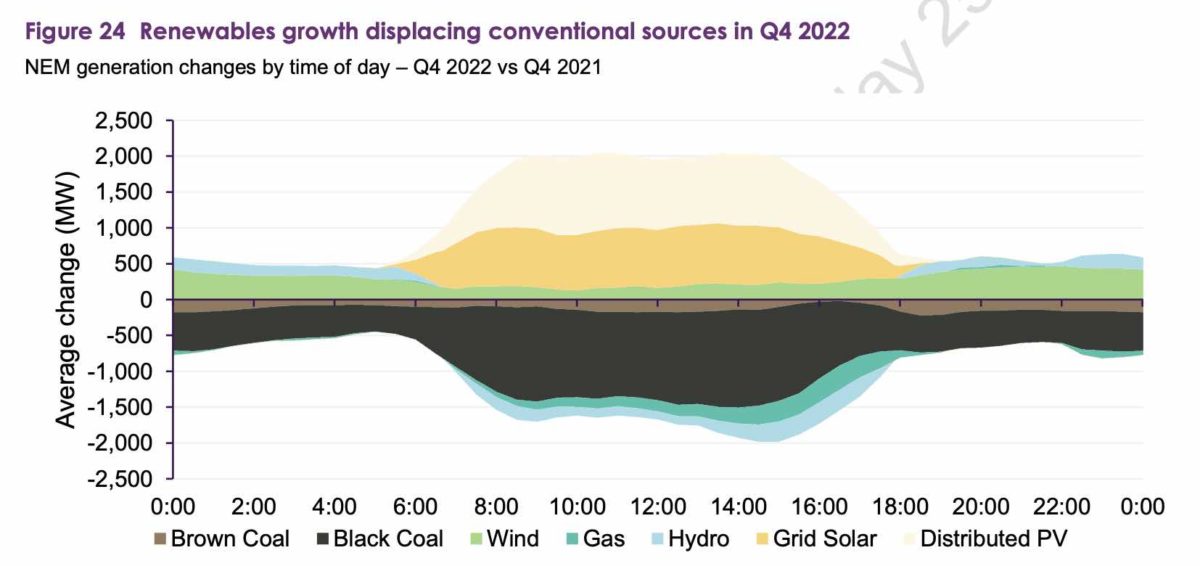
The December QED highlights the rapidly changing nature of the national grid, with renewables taking a record 40.2 per cent share in the quarter, a 4.5 per cent rise from the previous year.

The growth was led by a 409MW increase in the average output of 409MW and a 645MW increase in the average output of large scale wind and solar, with black coal falling by 798MW to its lowest level on record, and brown coal also falling by 128MW.
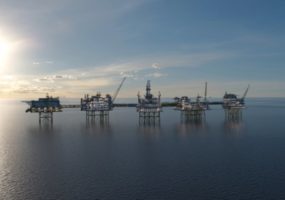
Gas also declined by an average 93MW to its lowest level in 18 years, and hydro was also slightly down.
On a daily basis, the changes look even more dramatic, with wind and solar – including rooftop PV – adding an average of 2GW in the middle of the day. Conventional sources, particular coal, were displaced.
That meant that wind and solar got to have a greater influence over pricing, particularly in the middle of the day where rooftop solar sent demand down to record lows, and more so in the southern states where they have a greater share.
But Queensland and NSW missed out. Even though rooftop solar often sent middle of the day prices towards zero and into negative territory, this was more than offset by the high cost of coal, and of gas and hydro when those generation sources filled in the gaps.
AEMO says that black coal-fired generators set mainland NEM spot prices at an average of $111/MWh, a significant rise from a year earlier, while hydro set the mainland NEM price at an average $139/MWh, nearly double a year ago. Gas set the mainland NEM price of $171/MWh.
That meant that those states less dependent on those conventional generators setting the price largely escaped the price hikes, with the exception of Tasmania whose average price was distorted by a range of transmission outages.

There were a couple of other significant features of the December quarter.
One was multiple records in wind and solar output, both on a total and average generation basis, and on some instantaneous milestones.
According to AEMO, the maximum instantaneous share of renewable energy generation n the NEM reached a new record high of 68.7 per cent. Within three years it is expected to reach 100 per cent, if the system supports are in place.

Distributed PV instantaneous output reached a record high of 10,685MW on December 27, 2022, while the output of grid-scale solar also reached a record high of 5,311MW on December 6. Wind reached an instantaneous high of 6,611MW on December 14.
Finally, and importantly, emissions from Australia’s main grid fell to the lowest on record for any quarter at 26.4 million tonnes of Co2 equivalent. Eissions intensity also fell to a record low of 0.62 tonnes of Co2 equivalent per megawatt hour, driven by the falling coal share and continued growth in wind and solar.

See also: “Glimpse of the future:” South Australia peaked at 91.5 pct wind and solar when links were down