“A statistician can have his head in an oven and his feet in ice, and he will say that on the average he feels fine.” Unattributed
The most important chart for global warming progress is China’s coal fueled electricity production

There are many arguments about equity and climate change, such as the contribution to cumulative emissions, and the end use of products produced by country of consumption rather than production. But in the end they are arguments about who is to blame.
At the moment who is to blame is less important than fixing the problem. And the problem is China’s consumption of coal mostly for coal fired electricity. India, Vietnam, South Korea are all in the mix, but China is the big prize.
We have previously argued that China’s demand for electricity is driven mostly by the change in demand for infrastructure construction, including housing and heavy industry. In this view there are two ways for China to change.
Firstly, you could dramatically change the economy to move away from construction. This will happen naturally but perhaps, from a global carbon perspective, not fast enough. Secondly, you could do what most economies attempt and that’s to decarbonise electricity production
China’s coal production is increasing at an annualised 300 mt this year
China reports monthly data on electricity production and coal production reasonably promptly. The data is not seasonally adjusted and neither January nor February data are reported separately. Instead a combined January February total is reported for the month of February.
Typically, for much of the data a monthly number and a year to date total are reported. ITK makes a crude assumption that Jan and Feb numbers are equal and we have made our own seasonal adjustment of some key series.
As everyone knows China with 1.35 billionn people is about 17% of world population, but China produces 50% or more of many global primary products such as steel , cement and coal. China’s electricity consumption remains very heavily biased towards industry.

We produced the following chart for which the key point to note is that, after years of decline coal production is now at the highest point it’s been for five years and is running about 300 mt (annualised) above last year.
The question now is whether production will stay at its current level. China imported 281 million tonnes of coal in 2018 by way of comparison. In the 8 months ended August China had actually produced 118 mt of coal more than for the same 8 months last year.
Since thermal electricity production, which we’ll get to, is pretty flat it means that the extra coal is either going to steel or replacing imports. And, guess what, the US dollar Newcastle coal price is down to $65/tonne. That’s not just China but all the other things going on.

The significance in terms of seaborne trade both to price and to Australia is seen from the following two charts.


Electricity
Mostly the following charts tell their own story.
In our view China is trying but not succeeding in controlling its coal-fuelled electricity. The main state owned generators are not doing well, when push comes to shove the implicit contract of economic growth as the price of political stability means that the well being of future generations is sacrificed for today’s population.
In this note we just look at the statistics. The implications of China’s nascent carbon price policy and the China’s decarbonisation and electricity plans in the next five year plan 2021-2025 remain completely unclear and this week’s UN climate summit won’t change that.
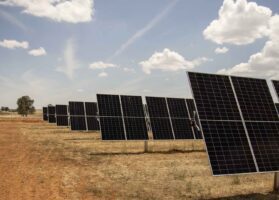
Nuclear production is growing much faster than wind at present. Solar PV production is growing rapidly, but is still tiny in comparison at just 2% of electricity production.
In comparison to Australia, China has a large hydro resource and could do much more on solar and wind if it had a real mind to do so.


