Despite 2020 being a record year for renewable energy output in Australia, total emissions have begun a steady increase again as the impacts of a fossil-heavy COVID19 recovery begins to hit the emissions data.
A new release from the government’s Department of Industry, Science, Energy and Resources (DISER) shows that emissions have begun their inevitable climb as the country’s economy begins to recover from the impacts of the Covid19 lockdowns of 2020.
RenewEconomy’s Michael Mazengarb wrote earlier that:
“Australia’s greenhouse gas emissions stood at 510.1 million tonnes for the year to September 2020, down 23.3 million tonnes from the period 12 months prior.
However, national emissions were up on a quarter-by-quarter basis, rising by 2.8 per cent in the three months ending September 2020, as Australians returned to normal routines, with transport emissions surging 11.7 per cent in the quarter”.
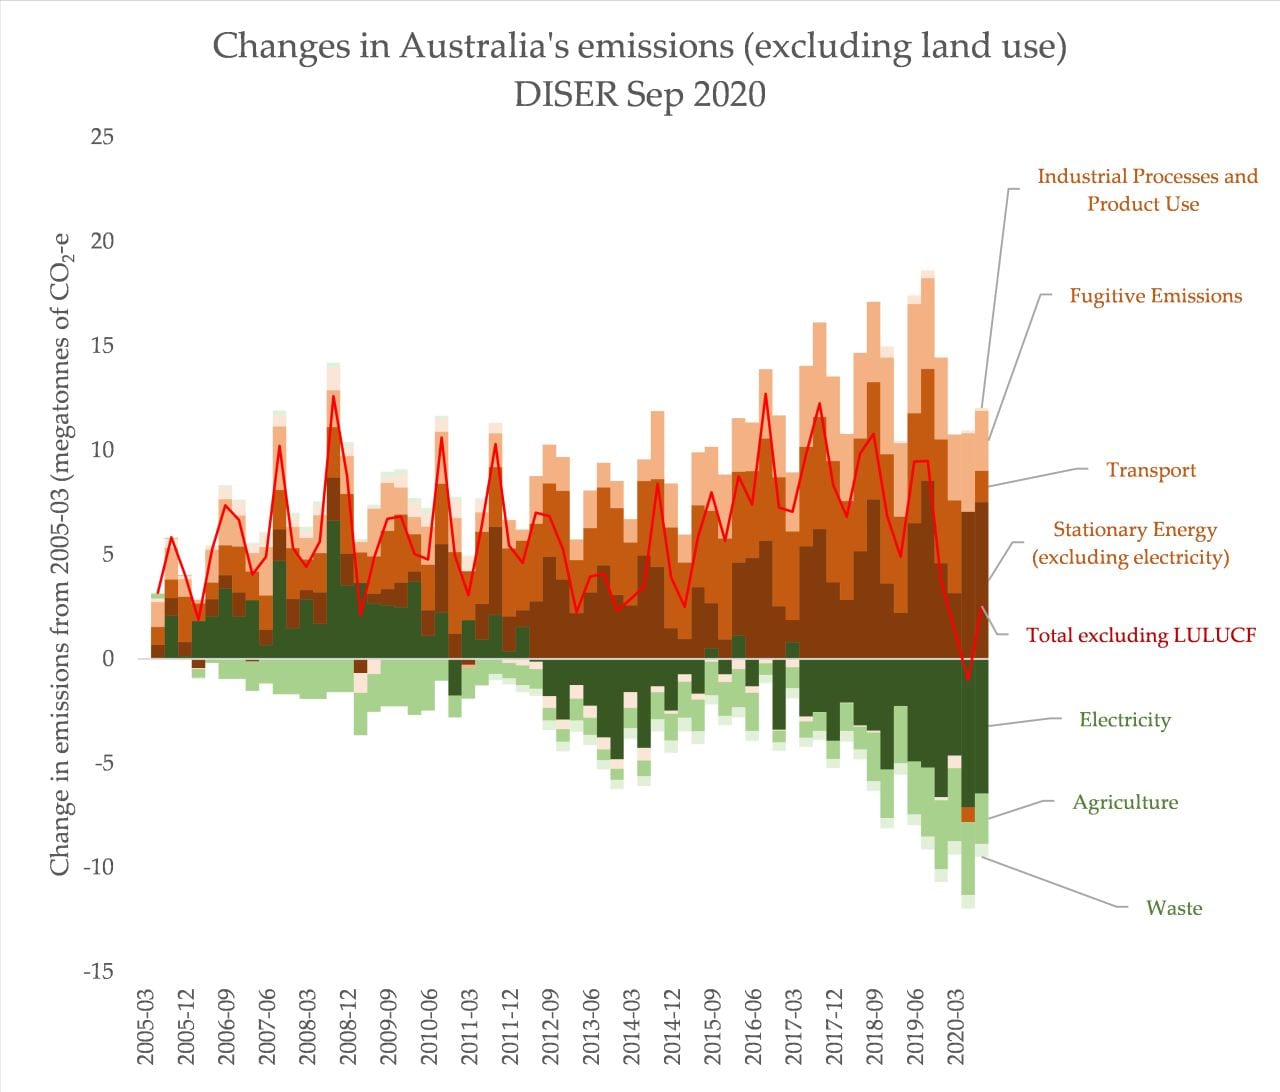
What the data clearly show is that Covid19 changed the emissions ‘tug of war’, as falling transport emissions and reduced global demand for Australia’s fossil exports tilted it towards a reduction. Covid19 recovery means back to business as usual, with flat-lining quarterly emissions. Of course, a flat line isn’t neutral: greenhouse gas emissions continue to accumulate. An overflowing bathtub isn’t in a steady state if the tap isn’t opening further – the flow needs to stop.
 Buried within the report are a few fascinating tidbits that are worth digging into.
Australia’s Paris target keeps changing (in the bad way)
As I’ve explored before on Twitter, Australia’s historical emissions data keep changing. In the land use sector in particular, very significant revisions to the methodologies used to estimate Australia’s emissions result in wild variations to historical data. I’ve collated every quarterly emissions report into one file, to show how different “versions” of the past have changed since 2014:
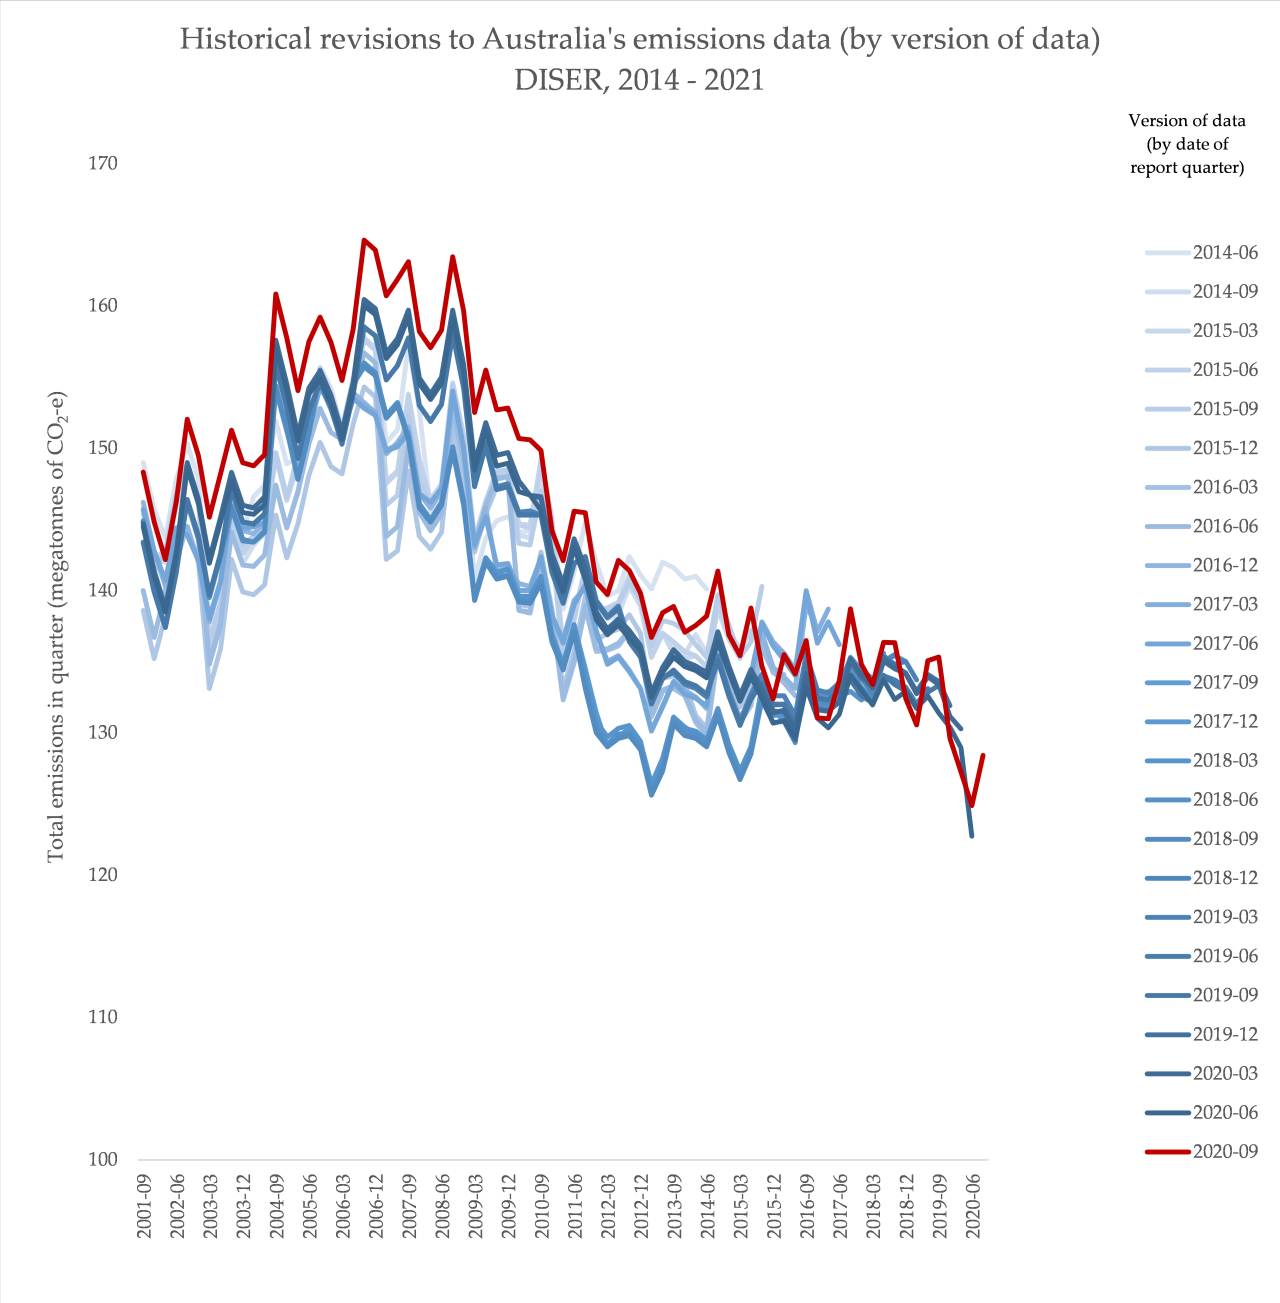 The pattern is relatively clear. Emissions are being frequently revised upwards, pre-2015. After that, they remain relatively ‘steady’, in that new quarterly reports don’t change things much. Digging down into the sectors, much of the change comes from revisions to the land-use sector, but this most recent report also heavily revises the methodology used to calculate fugitive emissions and the global warming impact of methane.
One consequence of this constantly shifting revision of Australia’s old emissions is that it changes the baseline year for Australia’s 2030 Paris climate target, which is a 26% to 28% reduction on 2005’s emissions. That value has changed between 591.9MTCO2-e in December 2015 to this most recent report, its highest level ever, of 628 MTCO2-e. That means this report results in the largest consequent change in Australia’s Paris target, to date:
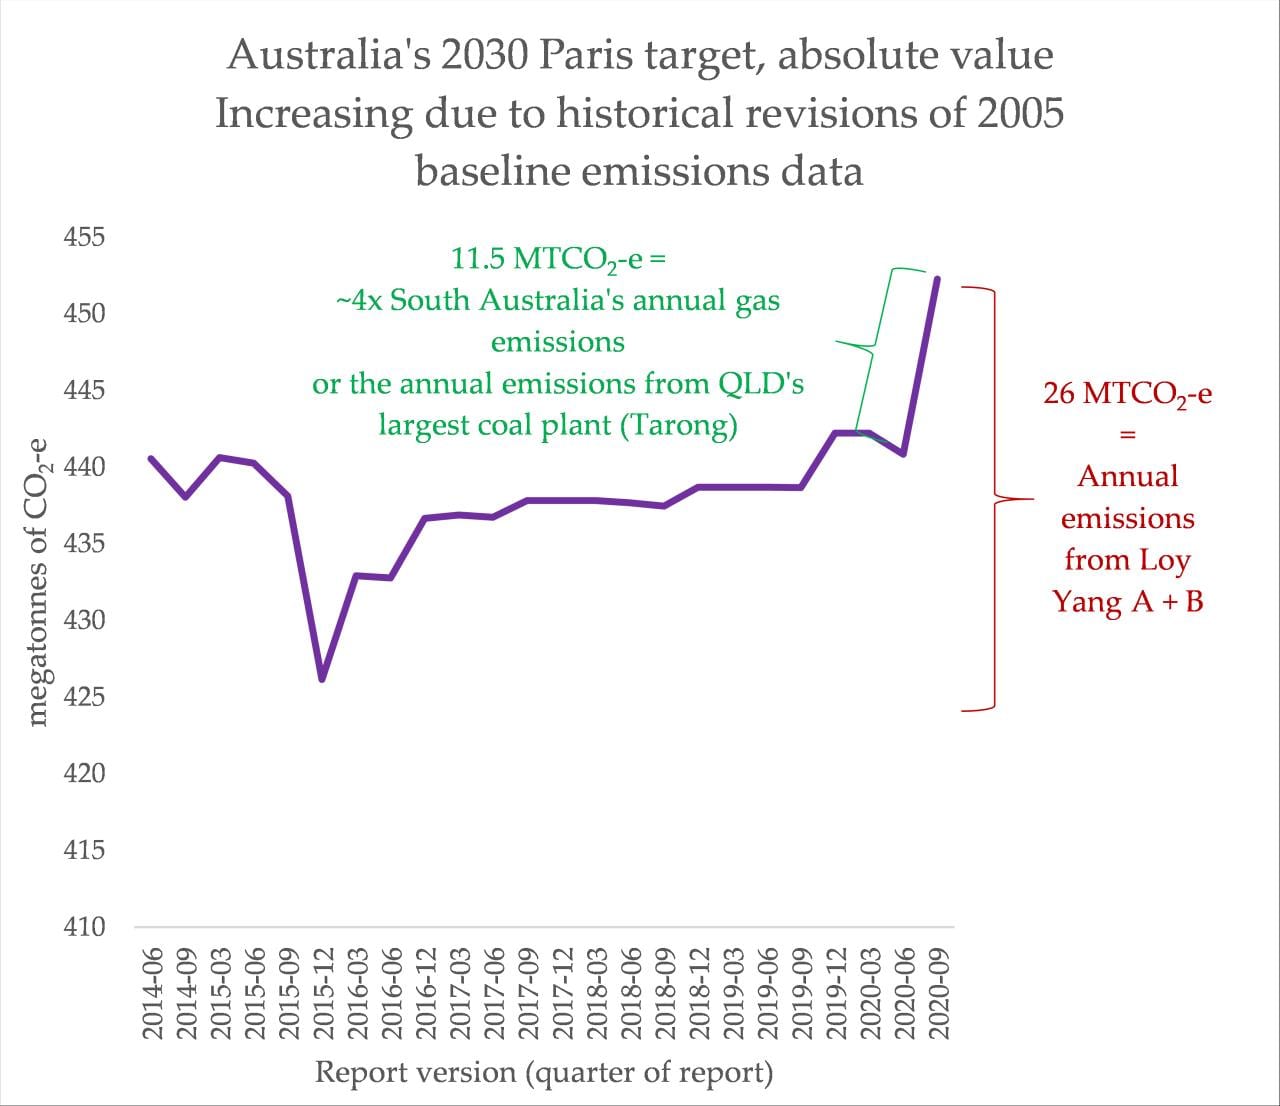
The change between the last report’s release and the one from a few days ago? A healthy 11 megatonnes of CO2-e on Australia’s Paris target. That’s around four times the annual emissions of South Australia’s gas power fleet, or the annual emissions of Queensland’s largest coal plant. Since 2015, the baseline changes have added 26 MTCO2-e.
Of course, there’s no evidence of intent here, and the message is more about the nature of Paris targets, which allow for loopholes exploited by countries around the world. A more responsible approach would be setting a carbon budget, but in general, the same government that brought you the Kyoto carry-over trick isn’t interested in actually addressing climate change.
It is, of course, a little ironic, given the well-earned criticism Australia received for refusing to update its 2030 Paris targets to reflect far more ambition and capacity to reduce emissions, and align climate policies with a 1.5C world. Turns out Australia really is updating its 2030 targets, just in exactly the wrong direction.
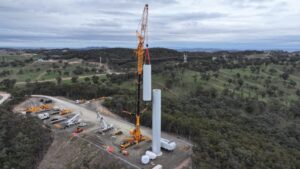
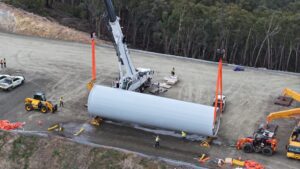
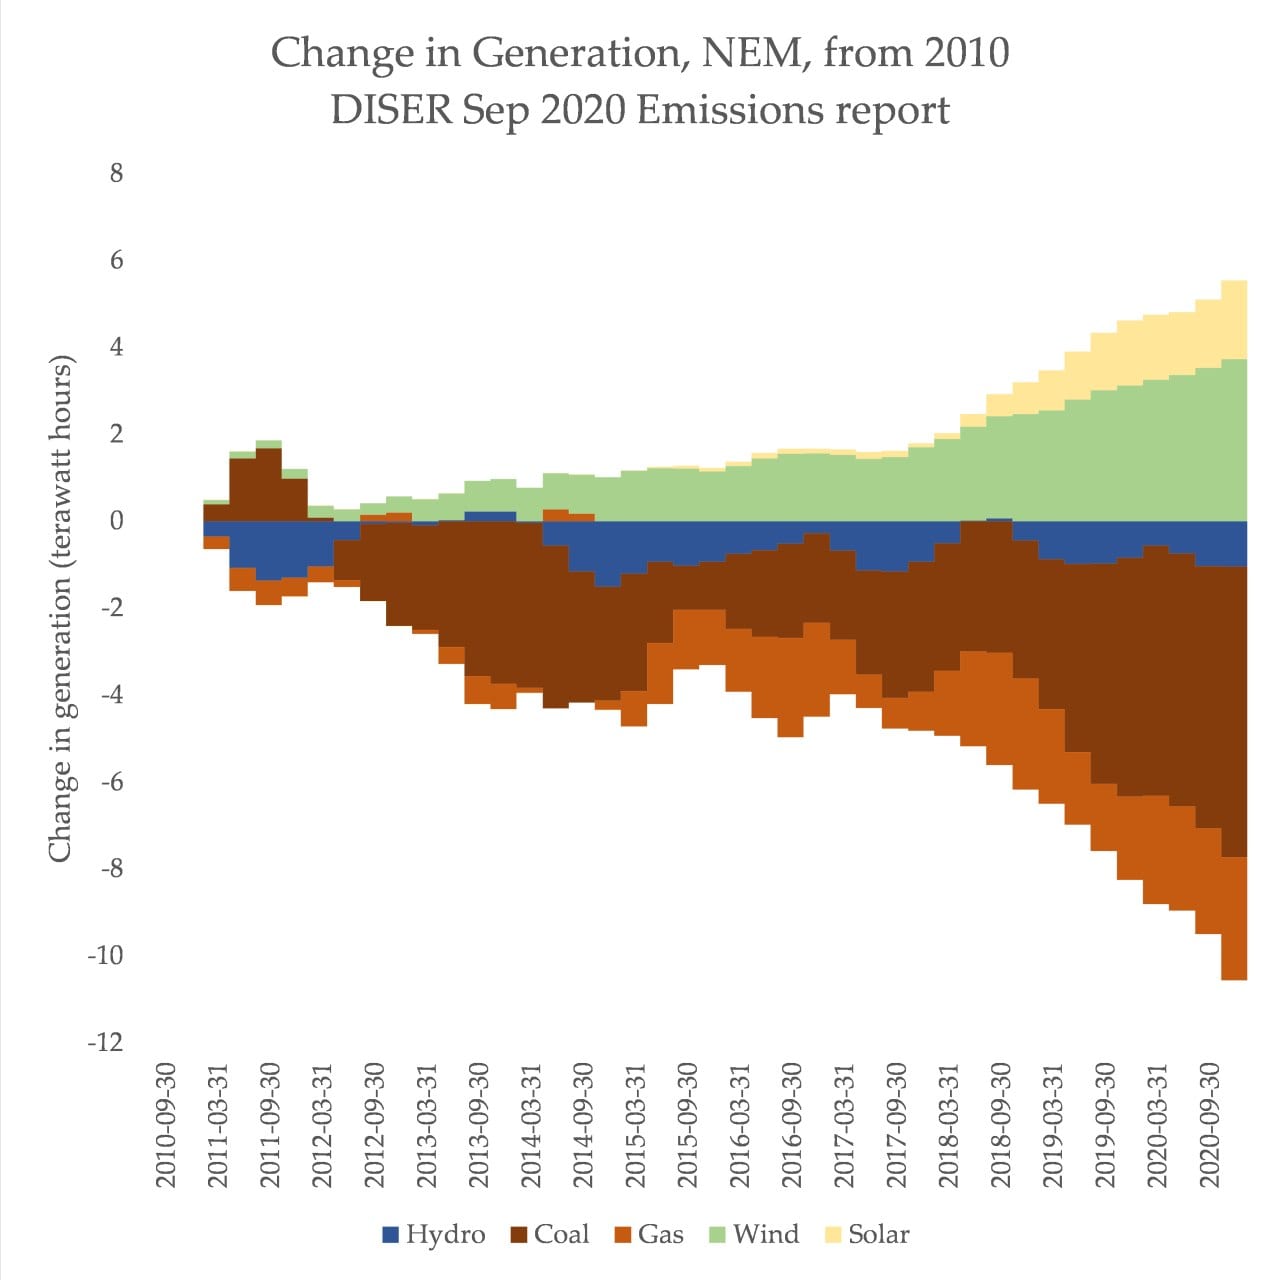
The NEM’s transition accelerated in 2020
Included in the report is a relatively important breakdown of how fuel types on Australia’s National Electricity Market have been changing. It’s a stark illustration of one half of the ‘tug of war’ – the change in renewable energy generation in Australia, alongside a decline in both coal and gas. In 2020, this trend accelerated, playing a part in falling emissions:
 Impressive, but this happened in spite of the efforts of Australia’s energy and emissions reductions minister, not because of it. Angus Taylor’s long history of anti-renewable policies and positions has been detailed plenty on RenewEconomy. Taylor will likely brandish this renewable growth at COP26, a major global climate meeting due to be held in November this year.
But in the light of advocating for a ‘gas fired recovery’ from Covid19, there’s not going to be any escaping the legacy laid out in Australia’s emissions data: far more action needs to be taken to reign in emissions. Now, there’s going to be a drumbeat of rapidly rising quarterly emissions data to drive that point home.