“I still have to pinch myself.” So says Peter Cowling, the head of the Australasian operations of the world’s biggest wind turbine manufacturer, Vestas, on the latest modelling on Australia’s rapid energy transition from the Australian Energy Market Operator.
And Cowling, who made the comment on last week’s episode of RenewEconomy’s Energy Insiders podcast, is not the only one needing to pinch himself.
More than a decade ago, the then Howard government brought an end to the mandatory renewable energy target because its target, a 2 per cent share of wind and solar, was deemed to be too extreme, and too threatening to the coal and gas incumbents.
The same argument – too much wind and solar – was put forward nearly a decade later when the Abbott government tried to kill, and succeeded only in narrowing, the renewable energy target because 20 per cent was deemed impossible.
The current energy minister, Angus Taylor, repeatedly made the same claims of “too much wind and solar” when he was appointed to his role.
Fast forward to the present, and the share of wind and solar has nearly quadrupled, and AEMO, whose main responsibility is to keep the lights on, is modelling a 79 per cent share of renewables (that’s an average over the year) by 2030 as its most likely and now central scenario.
Even the mainstream political parties are keeping up, even if some don’t like to admit it: Labor’s emissions target (a 43 per cent cut by 2030) proudly assumes an 82 per cent share of renewables by 2030.
The federal Coalition, which demonised Labor’s 50 per cent renewables target from the 2019 election campaign as “economy wrecking”, quietly assumes a 69 per cent share in renewables by 2030 in its emissions modelling. i.e. when too much wind and solar is not nearly enough.
The biggest reasons for the extraordinary pace of this renewables transition, and the dramatic change in expectations, are many.
Mostly they fall around the rapid falls in technology costs, and the subsequent embrace of wind, solar and storage by state governments of both sides of the political divide, and by corporate demand, keen to have cheaper and greener power.
See Zinc giant buys wind and solar developer in major green metals and hydrogen play
The Liberal government in South Australia is heading towards 100 per cent renewables in the next few years, on its way to 500 per cent renewables via renewable hydrogen exports, and the Tasmania Liberal government aims for 200 per cent renewables for the same reason.
The biggest player, and ultimately the most dramatic transition, will take place in NSW, the biggest grid, where within a decade nearly all of its coal generators will be retired, replaced by wind, solar and storage. The state Liberal government has a real plan to manage this switch from coal to renewables.
Victoria, of course, has a 50 per cent renewables target locked in by Labor’s legislation, while Queensland and the NT have similar targets – albeit with serious questions over how and if they will get there – while the ACT is also looking beyond 100 per cent renewables as it seeks to cut emissions in transport and building.

What does all this look like for the grid?
The first thing to notice is that the transition could happen even more quickly than described above. The new “central scenario” in AEMO’s draft blueprint is what is known as “Step Change”. Just two year ago, this was seen as an outlier by AEMO and the people it consulted. Now it is considered the most likely.
In another year or two, it could easily be replaced as the most likely by the newly modelled Hydrogen Superpower scenario.
At least that is what we would hope, because it is the only scenario that is considered to be in with global efforts to cap average global warming at 1.5°C. It is certainly the focus of the multi-billion dollar bets made by the likes of Andrew Forrest, and many other global energy giants such as Korea Zinc.
If it takes place, then 100 per cent renewables, or as near as dammit, could be reached on Australia’s main grid within a decade, and coal generation ceased altogether, rather than around 2040 in step change. (See graph above).
The second thing to notice is that we might not reach 100 per cent renewables in its purest form. It will probably be in the high 90s in terms of percentage, but at this stage it is likely that at least some peaking gas will be needed to fill in seasonal gaps, unless a new technology (green hydrogen) is able to fill the gap.
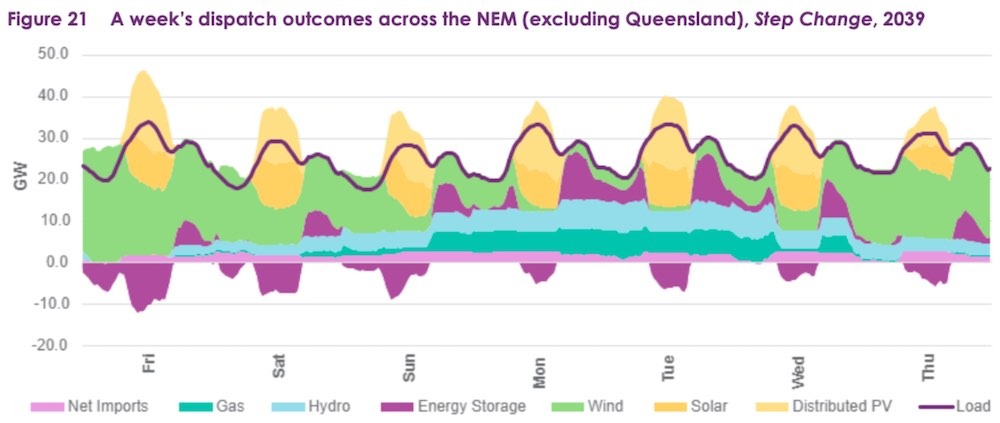
On a weekly basis, the generation share might look something like this graph above, included in the recently released draft of AEMO’s 2022 Integrated System Plan, the latest version of its multi-decade blueprint.
Of course, it’s not just a matter of building wind and solar and adding storage.
The grids need to be big enough in the right places to accommodate them, the connections process needs to be refined to facilitate it, and an overhaul of the market rules is also required. The federal government, if it doesn’t want to help, needs to get out of the way.
In the graph above, AEMO have chosen a winter’s week where at times wind and solar struggle to deliver enough supply (winter is actually going to be the most problematic season, rather than summer).
The graph above shows how different forms of dispatchable capacity interact to deliver electricity to consumers across NSW, Victoria, South Australia and Tasmania through a forecast winter week in 2039.
It has chosen to exclude Queensland consumers to showcase the dynamics in the other regions more easily, but Queensland generation is available to be imported.
“In this sample winter week, weather conditions are calm, cloudy and cool, leading to higher heating loads in the southern regions and limited renewable energy availability,” the AEMO report notes. “Above 0 on the Y-axis is generation consumed, and below 0 is excess generation stored.
“Figure 21 demonstrates why the ISP calls for technological and geographic diversity in the ISP development opportunities, supported by transmission capacity to share resources.
“In the illustrated week, Queensland and northern New South Wales wind offered reasonable generation, unlike the becalmed sites across the southern mainland and Tasmania. Inland locations for utility-scale PV are less likely to be shaded by cloud than the distributed PV in coastal cities.”
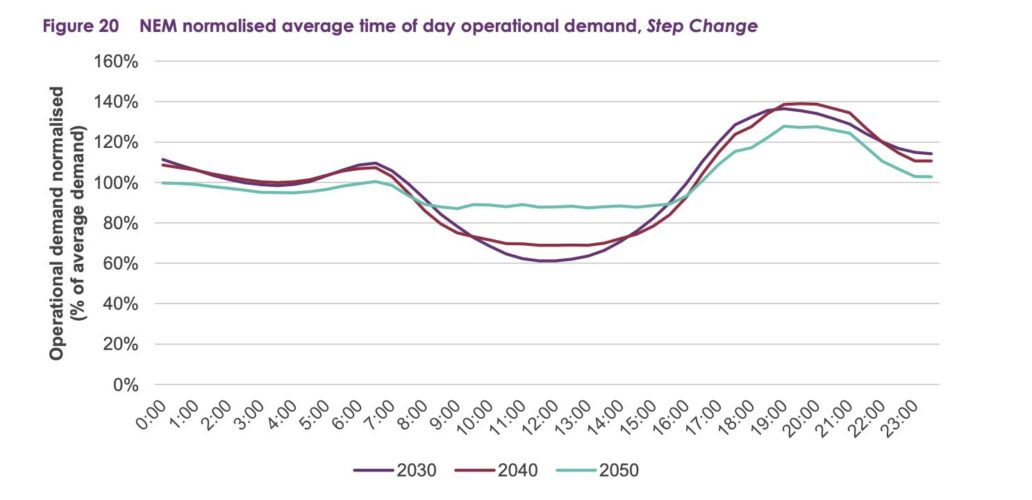
On a daily basis, it might look something like this, although it is important to note that this graph below is “normalised” and doesn’t account for the daily variabilities.
But in principal, AEMO says this:
Daytime minimum demand will initially be driven lower with continued uptake of distributed solar PV, but then be driven up by the electrification of other sectors and the opportunities for customer battery systems to charge during periods of excess solar generation.
Evening peak demand will flatten as distributed storages use the energy absorbed from distributed PV during the day and discharge this during the evenings.
EV charging during the day will further improve the operability of the power system. EV charging in the evening will add to system peaks and so to system costs, so charging infrastructure and tariff design to encourage daytime charging would benefit consumers.
And flexible demand response – not captured in this graph – and including even big consumers such as smelters – will also be used to flatten the shape of operational demand, helping to reduce the need for new firming capacity.

