Another day, another few projects work their way through the planning system. A wind farm in South Australia, a giant wind and battery project in Tasmania.
There are no shortage of contenders. In fact, according to the Australian Energy Market Operator there are more than 180 gigawatts of new generation queuing for connections, contracts or planning approvals. There’s also a heap of battery and pumped hydro projects in the pipeline, nearly 80 gigawatts with varying levels of storage.
That’s more than enough to meet Australia’s 82 per cent renewable energy target – several times over. And more than 40 GW of new wind and solar is advanced enough to have expressed an interest in the federal government’s Capacity Investment Scheme, the policy mechanism it hopes it breach the gap in six years.
But as the queues grow outside the grid, the numbers are changing ever so slowly on the grid.
In the past year, the share of renewables in Australia has only inched forward to a total of 38.6 per cent, according to OpenNEM, which sources its data from AEMO. And in South Australia, the country’s most advanced state, the share of renewables has actually gone backwards in the last 12 months.
The data for the 2023/24 financial year that ended on Sunday highlight what’s working and what’s not in Australia’s green energy transition – now facing yet more political hurdles as the Coalition digs in on its commitment to burn more coal and burn more gas, stop renewables and put the whole transition on hold as it waits for nuclear.
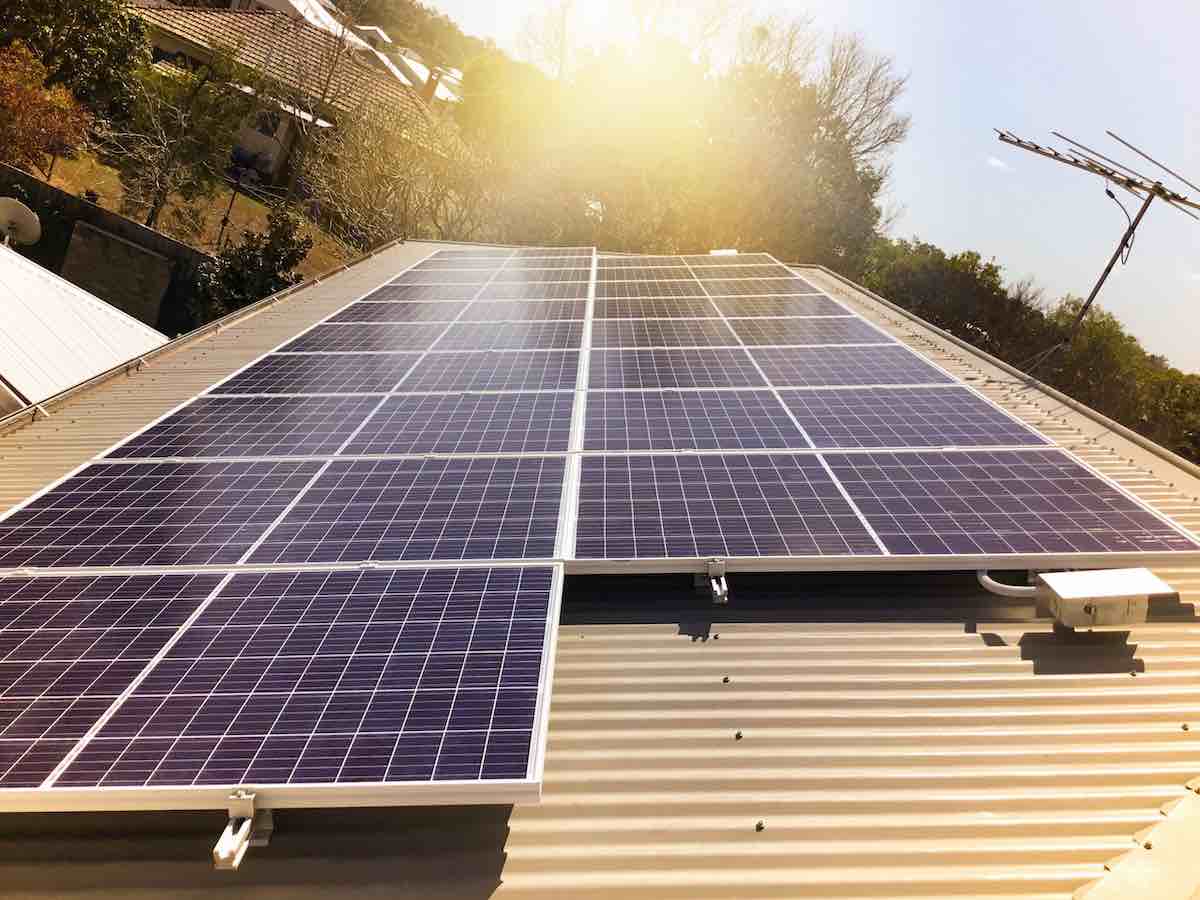
The healthiest part of the green energy transition remains rooftop solar, underlying the fact that this remains a transition that is driven as much by the community as it is by big business.
Australian households and businesses are still adding around 3 gigawatts of solar capacity to their rooftops each year, and in the last 12 months the output from these solar cells rose nearly 25 per cent to 24.2 terawatt hours, or 11.4 per cent of total generation on the country’s main grid.
In Western Australia, which has a separate grid to the National Electricity Market, a further 3.5 terawatt hours were produced in the last 12 months from rooftop solar, which boosted its share of the market to 17.5 per cent.
Battery storage is also looking strong, and it is playing an increasingly important, although still niche role in the market. Its output increased by 75 per cent in the last year, and accounted for less than one per cent of the market – usually in the evening peaks – as it is mostly focused on short term grid service needs.
But with the capacity and duration of battery storage across the country expected to quadruple over the next 18 months, its role will become increasingly clear and it is likely to overtake peaking gas in terms of output in the coming year – a situation that has already emerged in one of the world’s biggest grids in California.

Utility scale solar also had a good year, lifting its output by around 21 per cent – to grab a 7.4 per cent of the overall market – helped by the completion of the country’s two biggest solar projects at New England and Western Downs, and as numerous other projects that had been held up by grid connection issues also reached full output.
Wind energy, however, did not have such a great year. Its output across the NEM actually fell from 27 terawatt hours in 2022/23 to 26.6 TWh in 2023/24.
Its share of generation also fell from 13.0 per cent to 12.5 per cent. This can be sheeted down to an autumn and early winter “lull” that has seen total wind output fall by more than 20 per cent from its June quarter levels a year ago.
The other surprise is the fall in market share of wind and solar in South Australia – the world’s leader with 70.3 per cent in 2022/23, according to OpenNEM, but which fell to 69.3 per cent in the latest financial year.
The trends in South Australia reflect those of the broader grid – a big jump in rooftop solar (which leaped to a 21 per cent generation share in the last 12 months), a rise in utility scale solar and a fall in wind output, with no new wind farms added in the last 12 months and a combination of poor wind conditions and grid constraints limiting growth.
South Australia was the only state to go backwards in the past year, ironic given that its state government just a few months ago accelerated its target of reached 100 per cent “net” renewables from 2030 to 2027.
Of the other states, Victoria edged up ever so slightly to 40.5 per cent from 40.4 per cent, NSW grew to 31.6 per cent from 29.0 per cent, and Queensland brought up the tail with 28.5 per cent, up from 25.5 per cent. Over in the west, W.A.’s renewable share grew to 36 per cent from 34.9 per cent.
Tasmania’s share eased to 87 per cent from 91 per cent, although this was due to the drought that curtailed hydro generation and forced it to turn on its biggest gas plant for the first time in five years. Wind and solar output actually increased over the year.
One of the things to note in the last financial year is the price of generation. Rooftop solar, because it eats away at market demand during the daylight hours, had the lowest average price of $26 a megawatt hour (MWh) in the last 12 months, according to Open NEM.
Utility scale solar, similarly affected by the midday demand reduction, had an average price of $42.34/MWh, while wind averaged $61.55/MWh.
Brown coal achieved an average price of $72/MWh, black coal an average $106/MWh, and hydro an average $126/MWh. Coal retained an average 56.7 per cent of the market, down from 57.7 per cent a year ago and more than 70 per cent five years ago.
The most expensive during the past financial year were the technologies responding to the demand peaks, with battery storage at $190/MWh, peaking gas at $285/MWh and diesel generators at $793/MWh.

