Key Takeaways
- Around 130 TWh per year of new renewable energy generation is expected to be online by June 2029, which accounts for about 65% of 2024 demand.
- To meet future energy goals, an additional 16 GW of operational utility-scale renewable projects are needed by the end of 2027 to ensure capacity is in place by 2030.
In this note I look at the reasonably foreseeable wind and solar projects being built across Australia’s main grid and estimate their production over the next few years.
Uncertainties are many, not least of which is that just because a project has won a CIS (Capacity Investment Scheme) contract doesn’t mean it will be built at all, and only about 2/3 of those CIS projects either have planning approval already. (Or I am prepared to assume that the risk of them not being approved is minimal?)
Equally, there has been lots of economic curtailment as previously noted in these columns, and although batteries will absorb an incremental 20-25 GWh (gigawatt hours) of energy to charge each day, that may not be enough to stop some continued economic curtailment.
Network curtailment is also an issue but I expect in general it will be less of a one.
So I’ve come to realise that just look at new capacity in terms of gigawatts and potential capacity factors based on the renewable resource is too optimistic, or at the least requires cross checking.
In this note I don’t address price or even cost directly. ITK does have spot price forecasts in arguably the most renewable focussed and weather driven spot price model in the space, but that’s for another time.
About 130 TWh per year of new renewables is locked in
Adding operating, commissioning, under construction, and CIS capacity and new rooftop solar, and converting it to annual output gets me to about 130 TWh of new renewable generation, per year. A good starting point is that all of that capacity could be online by June, 2029.
That’s about 65 pct of 2024 demand, but there is another question in the amount of demand growth we will see over the next four years.
It’s important, probably very important, to appreciate that more capacity will be announced and will start the building process over the next four years, but I can’t see too much more than what’s discussed above being operational over the next four years. Maybe a solar farm or two.
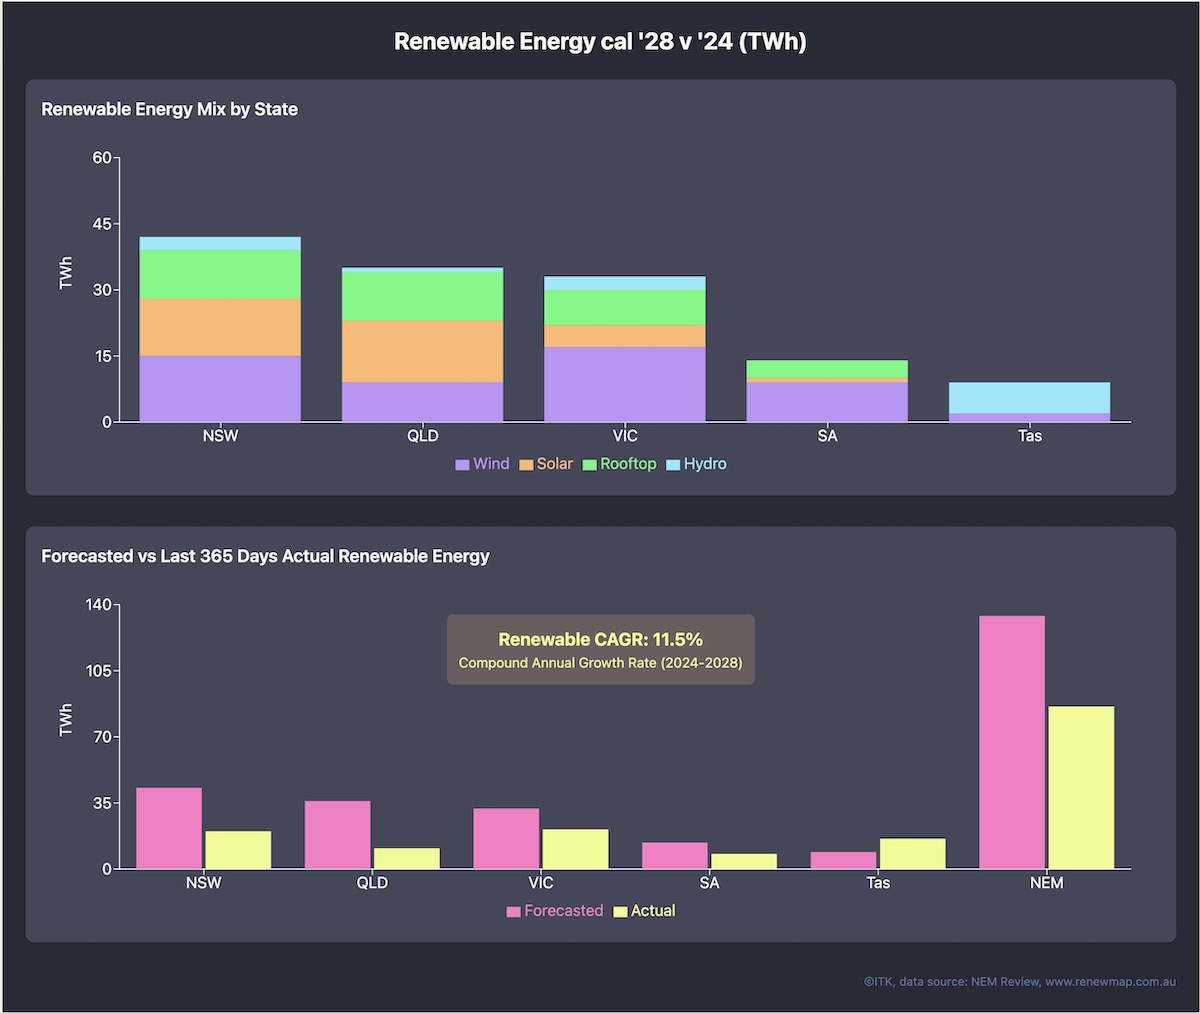
Forecastable renewable output. Source: RenewMap, NEM Review, ITK
In adding up those totals some allowance has been made for economic and network curtailment.
I haven’t considered economics because, although they are vitally important, they won’t make renewables be built any faster.
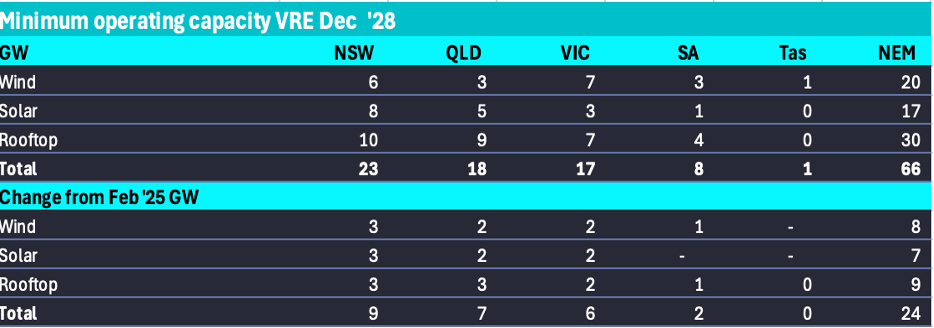
Operating capacity forecasts. Source: ITK
Reasonably foreseeable is not enough and I think more will be announced
As things stand the renewable share of output on the main grid is kind of on track for 60% by calendar 2028. Frankly even that will be an ask.
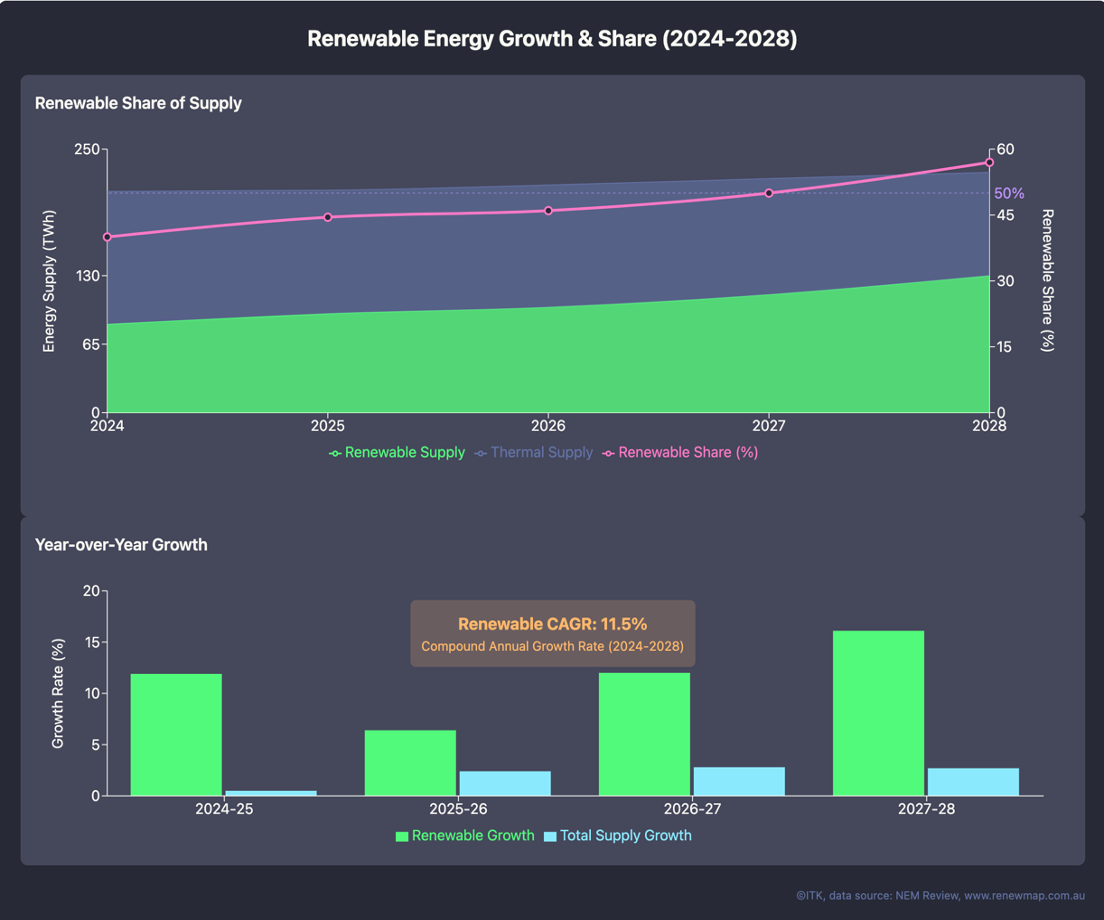
Renewable share of supply. Source: AEMO, ITK
The point about the renewable energy resource in Australia is there is a lot of wind and solar. Limited transmission sure but almost unlimited resource. As such there are 1000s of announced projects that are in some form of development, ranging from the multi GW level down to sub 50 MW.
Not all proponents want to go through the process required to get a connection from inside an REZ. Not all developers either need or want a CIS agreement.
Although I can look at the RenewMap database and speculate about what projects are likely to get up I think its easier to look at the price and other investment signals.
Eraring, Yallourn, and I would argue Gladstone power stations have announced closure dates but they cant be closed before replacement capacity exists.
If you spend enough money on maintenance, eg building a new ash dam for Eraring probably the coal stations can be kept running reliably for longe.
Equally, I am confident if new wind, solar and battery capacity is built simple economics will force coal generators to close. Solar takes away lunchtime revenue and batteries takeaway evening and maybe morning peak revenue. New wind will cut into the overnight volume.
So to me that is an investment signal, by building and operating a project you actually create more space for it by incentivising other generation to close.
There are positive price signals for wind and for batteries. Those signals look backwards. Looking forward promoters have to look at forecasts of supply and demand and flat load futures. Maybe the futures market could use some new products, wind futures, spread futures. There isn’t really a price signal for utility solar.
So all in all whether there is a CIS or any other policy I think it likely that some new projects other than those under construction or with a CIS contract will get into construction over the next few years. They will need to.
About another 16 GW need to be locked in by end of 2027
My estimates are that in addition to ongoing rooftop growth, under construction and commissioning, VRE CIS award winners announced to date, in addition to all that roughly another 16 or 17 GW of new operational, that is utility scale projects are required.
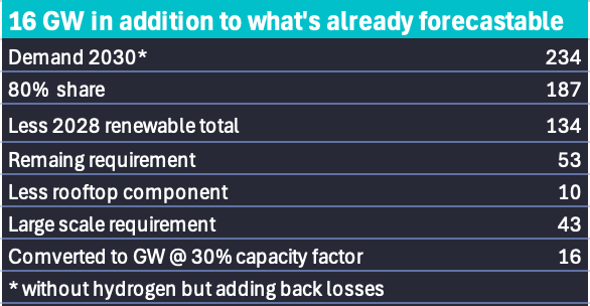
New supply required for 80%. Source: ITK
If we allow an average 3 years time for the supply to be constructed and operational then to hit the 2030 target all of that supply would have to be started no later than 2027.
In my opinion and with all the optimism and desire for success in the world it’s a very difficult target. Leaving aside the religious hostility and opposition to wind and solar in the LNP DNA, a negative disease that they spread as widely as they can particularly in QLD and regional NSW, the fact is that most of the NSW REZ transmission wont be available until 2030.
Possibly a lot more capacity could be built in the Riverina but the transmission capacity will be hopelessly inadequate and Transgrid so far hasn’t been convincing in its execution, albeit having to execute in the face of concerted opposition. Still, the ability to execute under pressure is the hallmark of talent.
What got us here
I update this visualisation on ITK’s website every week. It’s the single best indicator of progress I have. I use 180 days for annualisation to show the annual seasonality in progress, things look better (higher renewable share) in Spring and Summer and worse in Winter.
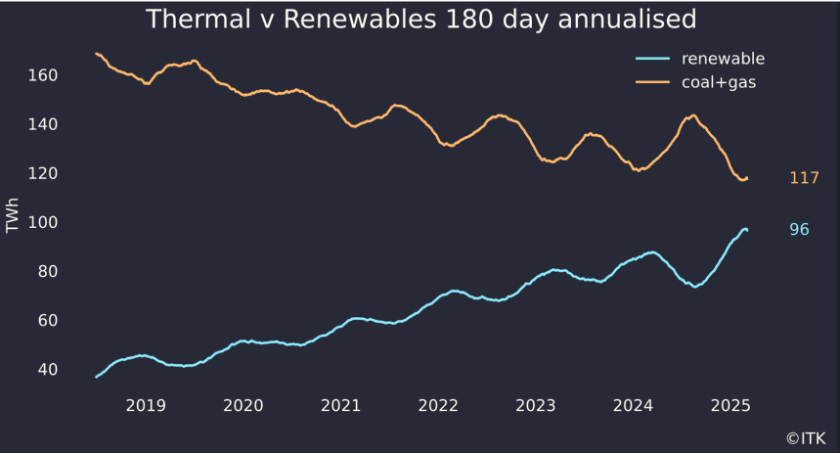
Thermal v renewables. Data source: NEM Review
Two main policies have driven progress to date. The REC scheme which basically was bipartisan at the beginning and when John Howard kept his right wing under control and Australia’s world leading rooftop program.
It’s not well understood but a very important driver of rooftop solar is the ease of connection to the grid. Networks facilitate it only a single phone call needed, so different to most other countries and particularly the USA.
And thanks to NEM Review data I also update this table every week also available on the website. Its described as demand share but supply share is probably a better term.
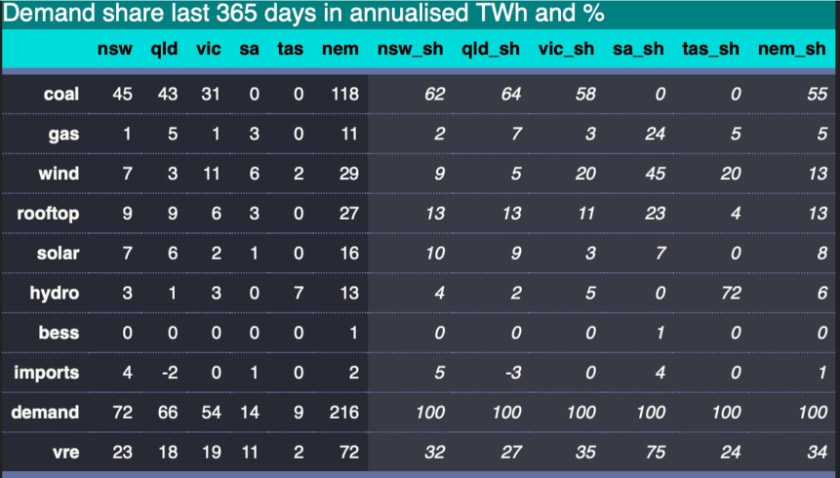
Across the NEM, coal share is now down to 55%. So next time someone tells you it’s still 70% you can tell them where to go.
If you just added up all the VRE capacity the total is now over 40 GW, but its fairly meaningless sum due to differences in capacity factors and place in the market.
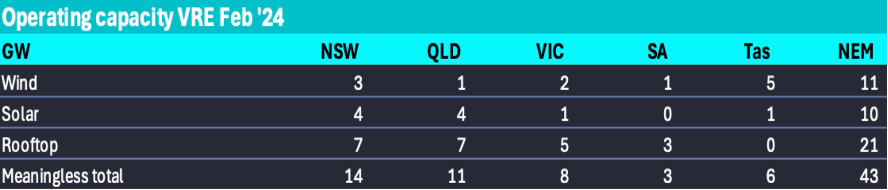
Rooftop GW are equal to Utility VRE GW, Source: RenewMap, APVI
But it does show as we all know that rooftop systems, and that includes commercial, are 50% of the installed renewable capacity and don’t required transmission. My own calculations are that if I ignore that distribution wires and poles have to be paid for somehow the LCOE of rooftop, is comparable to utility solar even ignoring economic curtailment,
Commissioning and under construction
Using RenewMap for capacity and NEM Review for max output one might say that there is about 2000 MW of un-commissioned capacity of plants in the commissioning phase.
Or, to put it another way, plants in the commissioning phase are about 1/3 of the way through on average, maybe a bit more as many plants won’t hit rated capacity even in the first year. Solar plants for instance commissioned in Winter wont see full potential until the following late Spring.
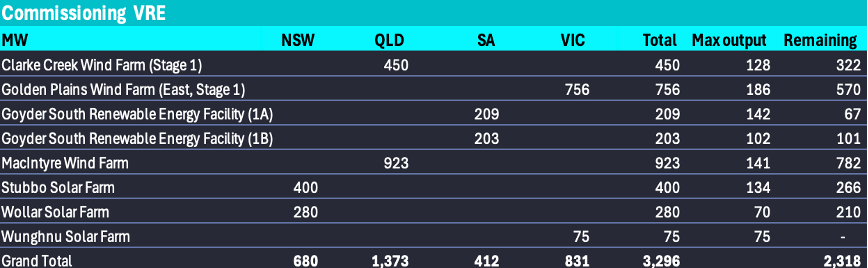
VRE in commissioning. Source: RenewMap
Even so we should expect even the 930 MW MacIntyre wind farm in Queensland to be fully commissioned by the end of the year.
Using RenewMap data as the source there are around 5 GW of projects under construction across three States in the NEM. These range from early stage for instance Lotus Creek Wind Farm to well under way New England Solar (stage 2).
I have excluded about 40 MW of small solar projects, mostly in NSW. I expect a lot if not most of this capacity to enter commissioning at some point 2026 or early 2027. Lightsource bp for instance stated Goulburn River had a 27 month construction process and started in August last year. Culcairn will commission mid 2025.
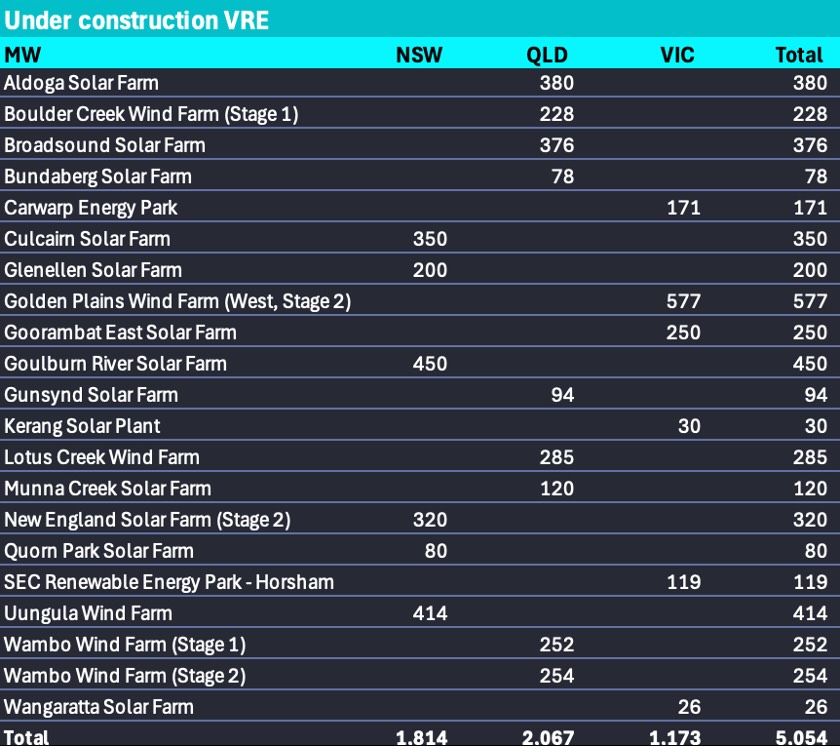
Under construction. Source: RenewMap
CIS awarded projects
Over 6 GW of projects were awarded a CIS contract in December 2024. Of those only 12 either have State and Federal planning approval or in the case of Goyder North are in my opinion virtually certain to get it. I included Spicers Creek in the virtually certain category and lo and behold it received the Federal tick on March 6.
Two large projects yet to get full approvals are Valley of the Winds and Sandy Creek. Both are more or less located in the Orana REZ in NSW.
None of the CIS projects have yet moved to FID and some are contingent on transmission. For instance the Junction Rivers project will depend on the NSW section of Energyconnect.
The AFR is suggesting that Junction Rivers has NOT won a connection agreement. However I expect some other project of equal size that is capable of being connected will take its place with or without a CIS.
The problem is when will these projects be commissioned? Let’s assume solar farms take 24 months from notice to proceed (NTP) and bigger wind farms 36 months.
Let’s also make an optimistic assumption that these projects get to NTP in 2025 then basically its the end of 2027 and 2028 for the energy to be really moving. Probably some will slip in 2029.
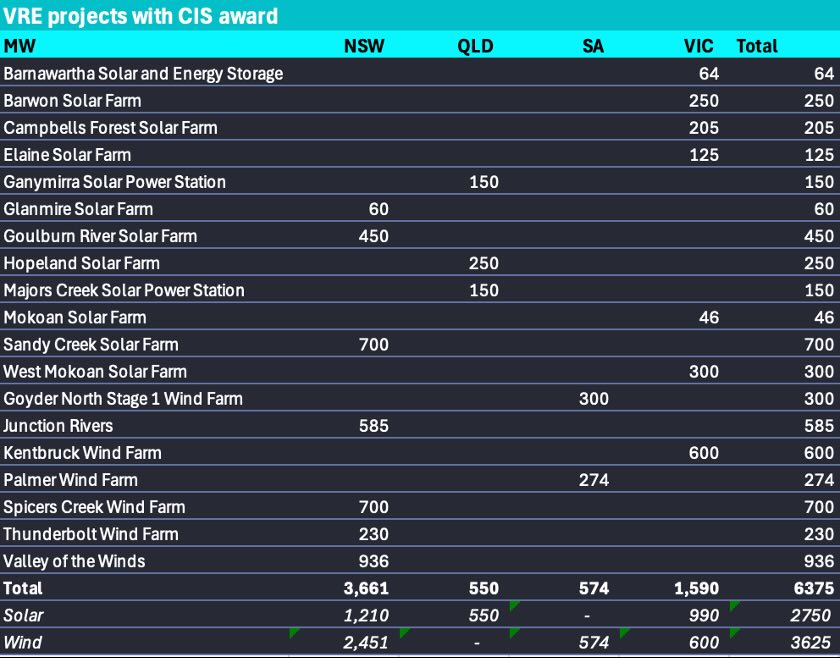
CIS award VRE projects. Source: DCCEW
Other projects are likely to get NTP even over the next year
There are a list of projects that are likely to get built, examples include 1.5 GW Yanco Delta that Origin paid $300 m for and Tilt’s 1.3 GW Liverpool Range wind farm which probably has a development cost to date of say $100 million.
The 0.4 GW Hills of Gold wind farm received its final Federal tick last week. There are the called in projects in QLD, one of which the 1.4 GW Bungaban wind farm has 80% of its output contracted to RIO.
The overall point is that there are plenty of projects and it’s likely there will be enough transmission. There are so many projects it’s not realistic to forecast which will go ahead. I do think though that some projects not part of CIS awards and maybe not in an REZ will still get built. Just don’t know what, where or when.
Transmission
None of the capacity under construction requires new transmission. It seems that much of the awarded CIS capacity will require new transmission.
Project EnergyConnect stage 2 is open from mid 2027 and Humelink may be done by 2028. Some Orana transmission is scheduled for 2028 and New England stage 1 2032 (well beyond the scope of this review)
Of the CIS projects the biggest part by far will be located in the Orana zone and so could not be expected to be commissioned before 2028. In Victoria the Kentbruck wind farm is located West of Portland on the South Aust border and relatively close to the Heywood line but there is no connection agreement looking at the RenewMap data.
Rooftop continue 2 – 2.5 GW a year
There are two competing schools for rooftop demand both of which I have sympathy for. On the one hand there is a view that we are approaching saturation and that rooftop growth will slow down. We are getting up to 40% penetration surely all the easy wins have been made. Equally the cost of rooftop solar isn’t falling any more and feedin tariffs could disappear.
On the other hand there is the official AEMO view informed by Green Energy Markets analysis that suggests we can continue at the current rate because new housing growth means that the available market keeps expanding.
On balance I lean a bit more to the official view in the next couple of years both because that is what I concluded from my own analysis but also because I suspect the commercial market still has some easy juice in it.
Batteries
The quantity and duration of batteries continues to grow. I published this table very recently but and now its updated for the CIS numbers but I expect there will be literally GWs more batteries hitting FID likely before any of the those with CIS awards are built.
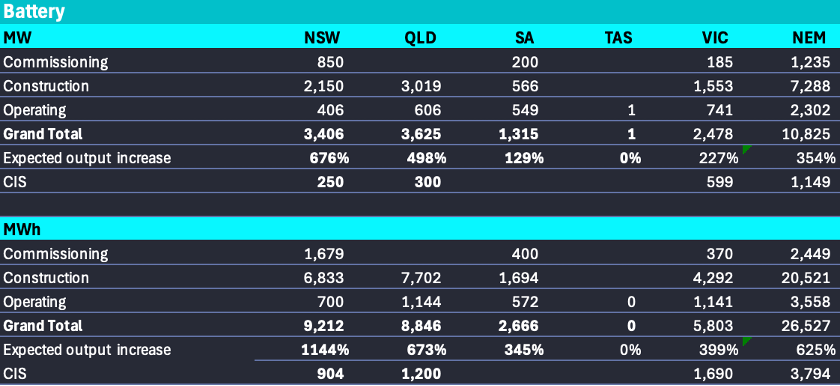
Batteries. Source: RenewMap
The only thing that will stop the surge in batteries is when the investment signal goes, likely either through a flattening of the daily price curve or through capacity utilisation of batteries not achieving the expected level.
Still my colleague Paul Bandarian put this chart together as part of of price forecasting tests and we expect it will need a lot of batteries to get that volatility back to historic levels.
Ignore the NEM title, it’s NSW. Without batteries it’s certain there would be increasing price volatility. With batteries there will be less. We are all going to learn the recipe over the next few years.
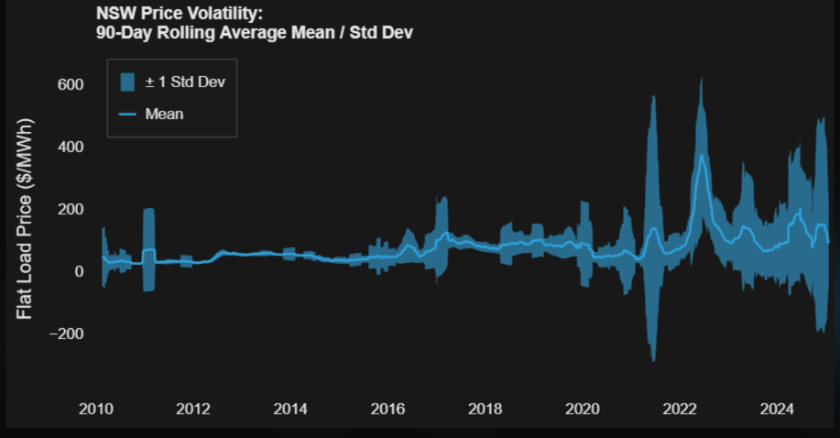
NSW price volatility.Source: NEM Review, visualisation: ITK