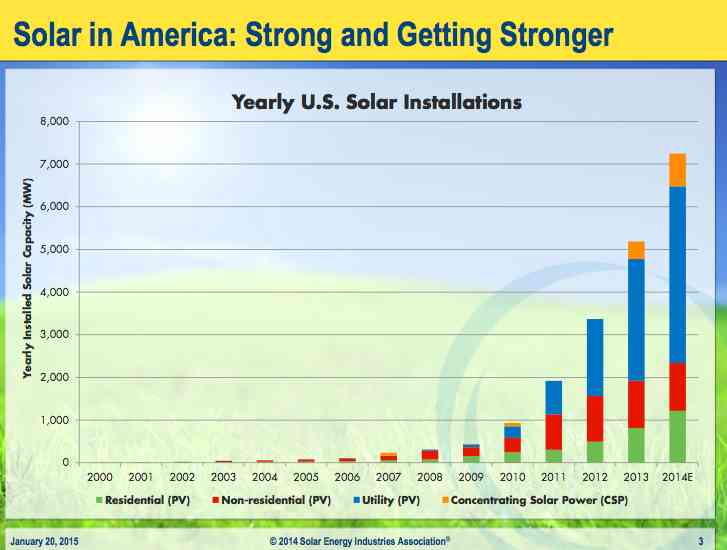
These two graphs pretty much speak for themselves. They highlight the surge in growth in the solar market in the US – encompassing residential and commercial solar, utility scale solar PV and concentrated solar power.
The graphs come from a recent presentation by the Solar Energy Industry Association in the US. By the end of 2015, it expects accumulated capacity in the US to reach 28GW. It has another 36GW of utility scale solar in the pipeline, and the residential market, now at just over one million homes, is also expected to surge.

This is represented in the next graph, with utility scale solar leading the way, and residential installations surging ahead of commercial and industrial installations. The SEIA expects 18 per cent growth and a new installation every 2.5 minutes.
In 2014, 36 per cent of all electricity capacity was solar. But by 2016, it will still account for 1.6 per cent of the total generation mix.