Australia continues to inch forward towards its renewables target of 82 per cent by 2030, with a big leap in construction and connections still needed over the coming five years.
The latest quarterly data shows a small gain overall in the Australia’s main grid when comparing the latest March quarter to the same period last year.
However, seasonal variations meant a fall from the record output in the December quarter, and some states actually went backwards in terms of renewable share, even if the output of wind and solar actually increased from the same period a year ago.
Overall, the NEM recorded 38.9 per cent share of renewables in the March quarter, down from 43.1 per cent in the December quarter (which is seasonally higher because of moderate temperatures), and ahead of the 37.3 per cent in the March quarter of 2023.
The story for the individual states was pretty much the same, according to the data sourced from OpenNEM.
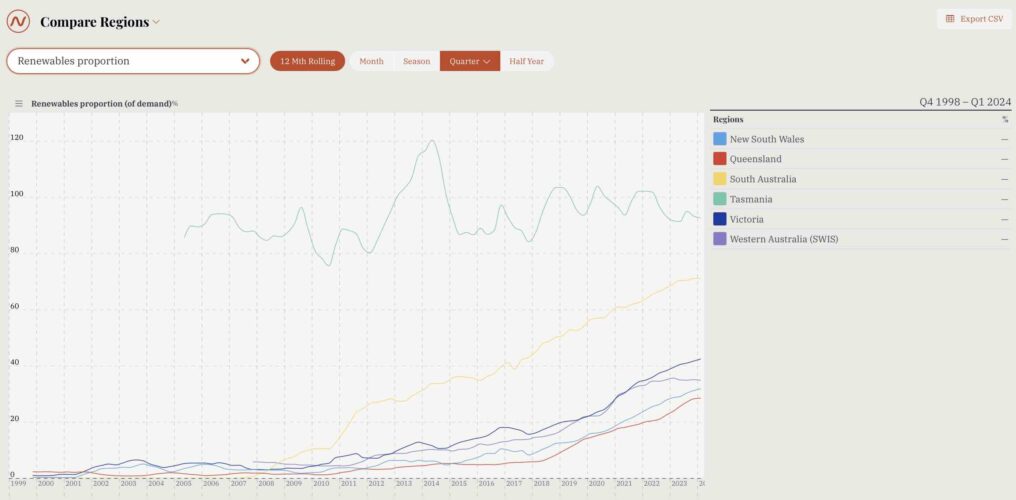
This graph below from OpenNEM shows the share of renewables state by state, although the graph below shows the 12-month rolling average to the end of each quarter. The data we report on below reflects the renewables share for the quarter itself.

The biggest state grid, NSW, which retains the largest amount of coal capacity (8.2 GW), had a 34.6 per cent share of renewables in the March quarter, down from 38.1 per cent in the December quarter but up from 32.3 per cent in the March quarter of last year.
Queensland, although it is the centre of most of the new wind and solar development in the country, retains the lowest share of renewables of any state at just 27.1 per cent for the March quarter, down from 32.1 per cent in the December quarter and up from 26.0 per cent in the same quarter last year.
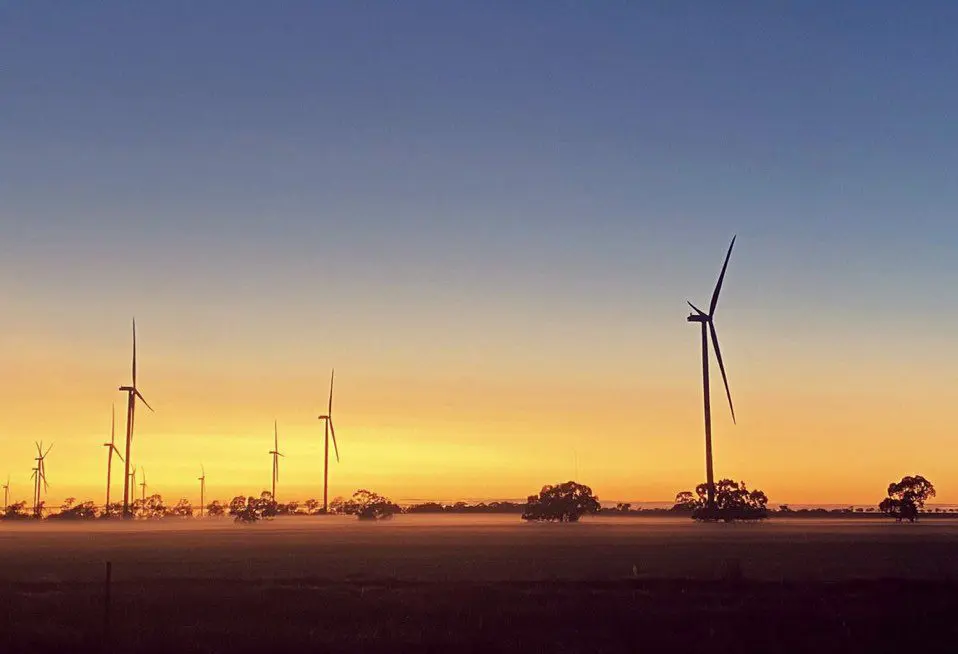
South Australia remains the leading renewables state, with 74.5 per cent in the March quarter – sourced entirely from wind and solar as it has no hydro.
That figure is down from 81.9 per cent in the December quarter, and slightly also down from 74.8 per cent in the March quarter last year, reflecting higher electricity demand this year, as wind and solar actually produced 200 gigawatt hours more, or nearly 10 per cent, than in the same quarter last year.
Victoria reached 43.8 per cent renewables in the March quarter, down from 46.7 per cent in the December quarter, but up significantly from the 40.8 per cent in the same quarter last year.
Tasmania, which is dominated by hydro, was at 75.6 per cent renewables, also down from both the December and the previous March quarters, but this reflected a fall in hydro output. Wind and solar production were both up from the previous quarters.
Data for Western Australia is not available as the market operator is yet to resolve its public data issues following the switch to five-minute settlements late last year.


