It is August and that means the latest version of The Wind Technologies Market Report (WTMR) has been released by the US DOE’s Energy Efficiency and Renewable Energy (EERE) office.
The WTMR is a chronicle of growth and economic and technology trends in the wind industry. Wind power has begun taking its place as a substantial contributor to electricity generation in the US. Due to its intermittent nature there is an increasing, and some suggest, premature, concern over limits on penetration.
This is probably driven in large part by the large amounts of curtailment in Texas in 2009. The 2014 WTMR may put some of those concerns to rest. Data in the report show that in Texas, curtailment has been slashed from 17% in 2009 to 0.5% in 2014 (figure 1). This occurred despite the backdrop of increased wind generation in Texas. It was due in large part to bringing added transmission online.

Figure 1: Changes in wind curtailment by date. Texas’ wind curtailment is labeled ERCOT. WTMR p38
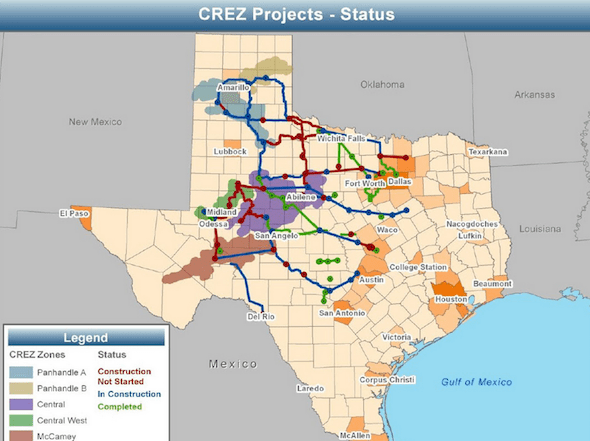
The improvement was no accident. As wind became valued as an important contributor to the Texas generation portfolio, it became apparent that to fully benefit from wind they would need to build transmission lines from where the best generation sites were to the population centers where it would be used. The Electric Reliability Council of Texas (ERCOT) set about defining Competitive Renewable Energy Zones (CREZ) and creating an electric transmission plan to assure that the electricity could get from the CREZs to point of use. The transmission lines have now been built and have nearly zeroed out the need to curtail wind generation.
ERCOT publishes quarterly progress reports for the CREZ program HERE . In the summary maps below (figures 1,2,3) it is easy to track progress over time of the transmission line build out. Comparing these to the data in figure 1 it is clear that the new transmission has successfully cleared the congestion that was limiting the use of wind generation. Perhaps most impressive is that the substantial reductions in curtailment occurred at the same time that wind energy generation increased by almost 100% (Figure 5 below).

Figure 2: CREZ transmission line project status November 2014 – Complete – Public Utility Commission of Texas

Figure 3: CREZ transmission line project status October 2013 – Partially Complete – Public Utility Commission of Texas

Figure 4: CREZ transmission line project status October 2012 – Partially Complete – Public Utility Commission of Texas

Figure 5: Texas Wind Capacity and total generation. EIA
This article was originally published on The Handleman Post. Reproduced here with permission

