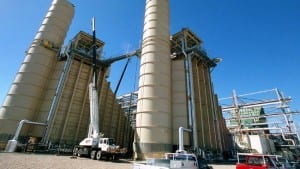
A string of unplanned coal generator outages – including the dramatic explosion at Callide in late May – resulted in nearly 1,000 days of “baseload outages” in the second quarter alone and sent average wholesale electricity prices to record highs.
New data released by the Australian Energy Regulator show that the average spot price in Queensland in the second quarter jumped more than three-fold over the same period a year ago to its highest ever level of $141/MWh.
In NSW, which was also hit by unplanned coal and transmission line outages, spot prices also trebled to an average $127/MWh, its highest level since 2007.
“In Queensland, NSW and Victoria, there were almost 1,000 days of cumulative baseload outages in Q2, 2021,” the AER says in its report. Nearly half of these outages (483) were unplanned, and the AER notes that these unexpected failures were the primary cause of the soaring prices.
The unplanned outages were most dramatic at Callide, but also occurred at Kogan Creek (the most modern and supposedly most efficient coal unit in the main grid), and at the Stanwell, Gladstone and Milmerran coal generators in Queensland, and at the Bayswater and Liddell coal generators in NSW.
In Victoria, the Yallourn brown coal generator was also badly affected by flooding in mid to late June, and Yallourn, along with Loy Yang A and Loy Yang B, also suffered other extensive unplanned outages due to various “plant failures” and “technical issues”.
In total, more than 6,000MW of coal capacity was unavailable in Q2 (that is an average over the whole quarter). Apart from the unplanned outages, the number of “planned” outages for maintenance and repairs was also two to three times greater than the previous year.
The “1,000 days” of outages occurred in just three month period, or more than 11 units per day.
 The second quarter is not usually a problem for supply due to mild temperatures and lower demand, but if this occurred in the peak summer season – when the heat can cause added stress to ageing coal and gas units – it could have been disastrous, and even more expensive.
Despite this, energy regulators and the federal energy minister Angus Taylor are pushing for so-called “capacity markets” to support the existing fossil fuel fleet, despite near unanimous objections from the industry.
In what appears to be a triumph of ideology over engineering, economics and the environment, coal generators could pocket more than $3 billion a year under the proposed scheme, without ever actually being able to guarantee production when it is needed most.
The spectacular Callide explosion occurred in late May, causing widespread blackouts and sent average weekly prices in Queensland to $347/MWh in the week commencing May 23 and $367/MWh in the following week.
Spot prices exceeded $5,000/MWh a total of 22 times across the quarter – the highest number of $5,000/MWh prices ever in Q2, and the first time since 2010 that any spot price was over $5,000/MWh in Q2.
Nearly all of these price spikes occurred in Queensland and NSW, which were also hampered by transmission outages that limited trade between the states. It’s interesting to note that Queensland and NSW are the only two mainland states connected to the main grid that do not yet have big battery installations.
The surge in spot prices in the June quarter, which also flowed through to a lesser extent to Victoria, South Australia and Tasmania, tarnished what was otherwise a spectacular year of price falls across the market.
The AER notes that volume weighted average spot prices ranged between $45/MWh in Tasmania to $72/MWh in NSW, delivering the lowest financial year prices observed since 2014–15 in Tasmania, 2015–16 in South Australia and NSW, and 2016–17 in Victoria.
Only in Queensland were 2020–21 prices higher than levels in 2019–20. Across the NEM as a whole, 2020–21 marked the first time since 2014–15 financial year prices were below $75/MWh in all regions.
That was mostly due to the increase in wind and solar capacity – up 3,127MW over the financial year. But nearly all of this was in NSW and Victoria.
South Australia and Tasmania added no new wind or solar in the last financial year, and Queensland added only 108MW of large scale solar. In the last quarter, only one solar farm (Gunnedah) and one wind farm (Bango), were added to the national grid, both in NSW, underlining the slowdown in new investment.
See also:
Large Scale Solar Farm Map of Australia


