In the latest Renewable Energy Index, large-scale power project construction work has broken through 10,000 jobs. Meanwhile rooftop solar PV installs almost broke 100MW for the month. Given they’ll deliver something close to $180m in bill savings the large lift in solar shouldn’t come as much surprise to anyone but Tony Abbott.

The big highlight in Green Energy Market’s Renewable Energy Index for August is that Australia has now broken the 10,000 construction jobs threshold in the large-scale renewable energy power project segment.
The number of construction job-years that will be created from projects currently under construction has risen from 9,897 in last month’s edition to 11,941 in August.
The large jump in job numbers occurred even though the net increase in projects under construction was just 3. The 109 MW Hornsdale 3 Wind Farm was reclassified as operational (although still to be fully complete) which led to a reduction in our estimate of construction jobs.
But this was well and truly overwhelmed by AGL’s Powering Australia’s Renewables Fund committing to construction what will be Australia’s largest ever wind farm– Queensland’s 453MW Cooper Gap Wind Farm.
Employment numbers also received a boost from Edify Energy committing to a further 2 solar farms in Queensland of 200MW in capacity.
These three projects have now pushed Queensland ahead of NSW in terms of large-scale renewable energy construction jobs. Queensland has leapt from 2,676 job years in our July Index, to 5,203 in August.
Figure 2 – Job years of construction work supported by renewable energy projects under construction in August 2017

One other interesting item that stands out from these charts is how poorly WA performs. The low level of renewable energy construction activity is highly unusual, even taking into account their lower population base.
When you consider the SWIS enjoys a superb wind resource, a solar resource comparable to NSW, and is characterised by a high underlying cost structure for fossil fuel generation it should at least be well ahead of SA, which has smaller population and electricity demand.
However, until just recently regulatory rules prevented the WA network operator from connecting new generators in regions where the grid capacity was insufficient to avoid congestion and constraining of generator output.
In addition, the main power retailer in the state- Synergy – has encountered difficulties landing on a strategy for how it might best procure LGCs (whether to buy from others or build its own projects).
Resolution of these issues is pivotal to WA capturing a greater share of renewable energy construction activity.
Another major highlight for August was the level of rooftop solar capacity installs seen in the STC registration data. We just slightly fell short of breaking 100MW for the month, with 97.6MW creating STCs.
Such levels have only been exceeded in Mid 2011 and mid 2012 when we saw surges of demand from customers driven by a rush to get in on expiring premium feed-in tariffs that were four to six times what they are now, and STC rebates that were 3 to 5 times current levels.
The high level of installs in August builds on what has been a spectacular rebound in the solar market that began back in November 2016 after a steady decline post solar STC rebate multipliers and premium feed-in tariffs.
Now there are no prizes for guessing why we’ve seen solar installs surge over this period.
As I explained back in April (see: Rooftop solar enjoys second boom as fossil fuel scare campaign backfires), in response to reports of impending surges in electricity prices, both households and businesses recognised what Tony Abbott seems desperate to deny – solar is a great way to lower electricity bills.
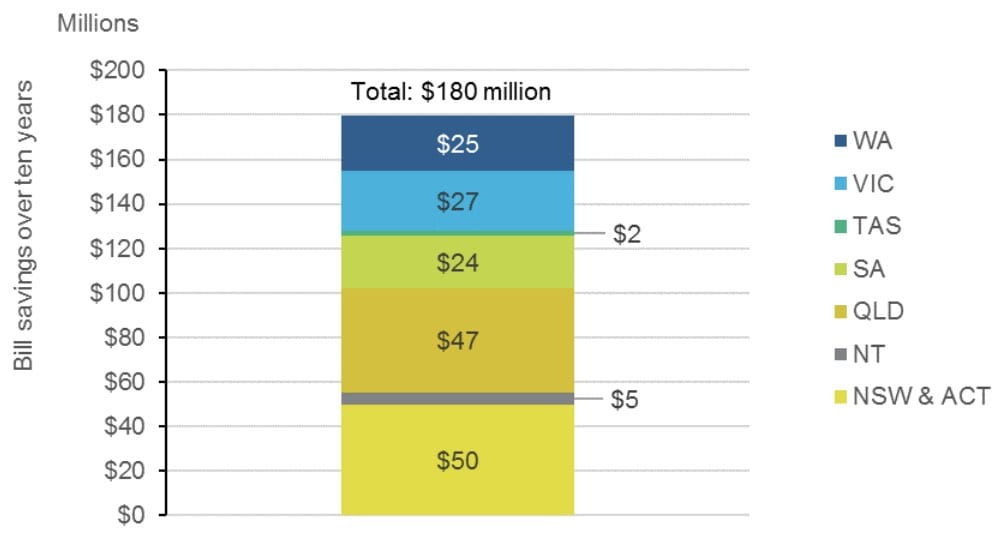
We estimate that the 97.6MW recorded in August will deliver about $180m in power bill savings over the next ten years (and the solar systems should hopefully last 20 years) for the 15,225 households and business premises that installed them.
Figure 3: Power bill savings (in $millions) over next ten years from rooftop solar systems installed in August 2017

This jump in installs has led to a corresponding rise in employment. We estimate these systems would have required around 4,893 people engaged full time over the month in the sale, design and installation of solar systems.
This compares to 4,660 in July and an average across the 2016-17 financial year of 3,769 full time equivalents.
Figure 4 – Number of full-time equivalent jobs by state in the installation and sale of rooftop solar PV systems installed over August 2017

Overall power generation from renewable energy in August was just shy of 20% share across the east coast NEM and Western Australian South-West Grid. Wind output was strong over the month with a NEM-wide average capacity factor for fully operational wind farms of 40.1% and 34.6% in the WA SWIS.
This came on the back of record levels in NEM in July but an extraordinarily becalmed June.
Hydro output was slightly down on August averages from the last 3 years but overall hydro output across the year has been well down as Snowy and Hydro Tas seek to manage water storages that have been run down due to poor rainfalls and high generation levels last year.
Figure 5 – Renewable energy power generation by fuel & market share for west & east coast power grids – August 2017

We can expect the market share of renewables to grow noticeably over the next 12 to 24 months as projects currently under construction become operational.
However there will be dips and leaps overlaid on top of a long term growth trend due to variation that characterises the output of both hydro and wind.
In addition, looking beyond 2020 continued growth outside of rooftop solar will hinge on either:
- the states pressing on with their own initiatives; or
- hopefully the federal Liberal-National Party coming to an acceptance of the need for a long-term emission reduction policy framework.
Tristan Edis is Director – Analysis & Advisory with Green Energy Markets. Green Energy Markets assists clients make informed investment, trading and policy decisions in the areas of clean energy and carbon abatement. Follow on Twitter: @TristanEdis
The analysis prepared for our Renewable Energy Index relies on underlying data and analysis within our STC-Solar and LGC market analytical subscription products as well as Global Roam’s NEM Review.
Tristan Edis is Director – Analysis & Advisory with Green Energy Markets. Green Energy Markets assists clients make informed investment, trading and policy decisions in the areas of clean energy and carbon abatement.


