Summary
Delightful Autumn weather and a late Easter lead to soft electricity demand. Despite that, spot electricity prices remain over $100/MWh indicating that there may still be an issue when demand lifts. Gas prices softened but were still high. Share prices were ok, for the most part.
Basically, we are in a holding pattern while we wait for court decisions, the full Finkel Report, federal government policy announcements, Victorian government renewable auction process developments and legislation to set the path forward.
Turning to the weekly action
- Volumes were noticeably soft over the NEM down 5 per cent for the week, 4 per cent for the past 30 days compared with PCP. Despite the record volumes during the heatwave across the NEM volumes are now flat on last year for the calendar year to date. Queensland remains up for the year, but Victoria is well down. NSW, the bellwether state, as it doesn’t have an aluminum smelter out, or a CSG industry uplift, is showing 2 per cent growth calendar YTD. Fig. 7 shows the softness in what is the seasonally slow part of the year.
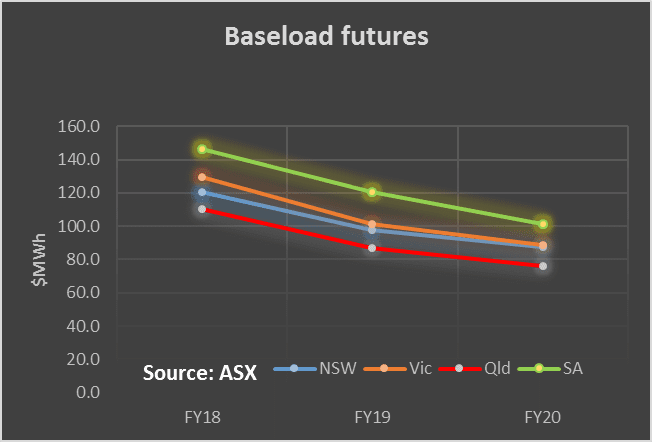
- Future prices continued to rise, particularly in the out years. Even in FY20 the futures market indicates a price of around $90 MWh across the NEM. Still it’s worth noting that out year futures prices are not necessarily good indicators of what the price will actually be in those years. In theory, in the face of flat demand we’d expect the price to settle at the cost of replacement supply. For renewables, that’s the cost of the new renewables + the cost of guaranteeing deliverability. At the moment we see those two numbers combined as in the range of around $90-$120 MWh. Not too different to the futures prices.
- Spot electricity prices. Although prices softened over the Easter period they remain strongly up over last year, particularly in Victoria (129 per cent). This clearly shows the reduction in supply has made the market physically tighter. It remains unclear how much of the increased spot price is due to actual tightness and how much is due to increased market power of the remaining suppliers. But in the short term it doesn’t really matter. The high spot prices in the time of soft demand mean that we have to continue to keep a close eye on what happens when demand lifts. It’s the December – February period that remains the issue.
- REC prices notionally weakened. However there is very little evidence of trading that we can see. Still, all that new renewable supply, and notwithstanding that not all will be used for RET purposes, will have some impact on price. We still see a short fall versus the target.
- Gas prices softened, not unexpectedly, in what is the slow part of the year. At least on the north coast of NSW, where I spent Easter, nicer weather would be hard to imagine. Winter peak demand, though, will tell a different story.
- Utility share prices. Not much action in short-term share prices, other than in minnow Redflow, but Origin Energy (ORG) is up 10 per cent on the month and 38 per cent compared to last year. The worst has likely passed for ORG, but its year-on-year performance still lags both ALG and IFN.
We expect both SKI and AST to show some benefit from the delisting of DUE and the cancellation of the IPO of Alinta. In our view investors remain hungry for yield. We expect investors and potential investors in SKI and AST (the remaining wires and poles stocks) to be dependent on the outcome of the Federal Court case into the NSW distributors. This vital decision has implications for electricity consumers all over Australia. Originally expected in the March Quarter, we continue to wait on the Court’s deliberation.
Speaking of RFX, we note the company released a statement to the ASX noting that deliveries have been halted while problems with electrolyte impurities in one batch of batteries are sorted. RFX had $1 million of backorders at that point with 96 batteries in stock and another 120 in transit. Response to a strategic review will be released to the market within a few weeks.

Share Prices


Volumes


Base Load Futures

Gas Prices

David Leitch is principal of ITK. He was formerly a Utility Analyst for leading investment banks over the past 30 years. The views expressed are his own. Please note our new section, Energy Markets, which will include analysis from Leitch on the energy markets and broader energy issues. And also note our live generation widget, and the APVI solar contribution.


