- Volumes : In the week ended October 28, volumes were down 1% across the NEM compared with last year, even in Qld volume growth has slowed although still up 4% for the calendar year to date. South Australia volumes look particularly soft. Is this the car industry? The persistent message is that electricity prices are up both in the spot and futures market and the gas market compared with last year even though electricity volumes are basically flat. Gas demand has dramatically increased because of LNG but electricity supply is falling and so are the number of suppliers.
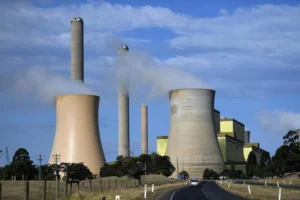
- Future prices:. Rose again as the market increasingly factors in the Hazelwood closure. We read comments that spare capacity in NSW and QLD will pick up the slack, and it probably will. However, it’s not just the withdrawal of capacity, it’s the tightening in the number of suppliers, the need for Engie to buy back the forward contracts Hazelwood has entered into, NSW coal costs, and the transmission constraints that will all lead to price increases. Futures prices in South Australia are now sitting at around $100 MWh for the next three years and Victorian and NSW futures are up around $60 MWh (up 50%). For industrial consumers of electricity these are steep price increases. Renewable energy advocates need to understand that this is going to cause a business backlash and Government concern and be prepared with good answers. Saying prices won’t rise because there is spare capacity runs the high risk of just being plain wrong over the next year or two and looking naïve and amateur into the bargain. A better answer is needed, and fast. Closure of Portland Aluminium smelter cannot be far away and this too will be blamed on renewable energy even though its been coming for years. It’s time to go on the front foot and discuss the new industries that can be supported.
- Spot electricity prices. Were soft over the weekend, South Australia was negative $15 MWh average on Sunday and Victoria $6 MWh. Overall averages for the week though were up 20% on PCP for the NEM as a whole. Since consumption is flat that price increase is more or less due to reduction in both supply and the number of suppliers.
- RECs prices are at the limit and are unchanged.
- Gas prices. Fell during the week in NSW but remain strongly up on last year. As APA Mick McCormack pointed out in our podcast, the marginal GJ of gas in the NEM comes from QLD gas that can either be sold into the LNG market or into the domestic gas market. Shell (owner of the QCLNG projcect) is really the only participant with the flexibility to do this because APLNG and GLNG don’t have the broad international LNG supply portfolio that enable them to satisfy demand from the cheapest global source. Oil prices are gradually drifting upwards, albeit much more slowly than was expected at the start of the year. Brent currently around the US$50/b mark will need to get over US$80 for serious gas exploration to start again in Australia.


- Share prices were soft this week in line with the broader market. Infigen has just reported its quarterly revenue numbers. Production was up 11% to 437 GWh and price was up to $143 MWh (LGC and electricity) up 40% on PCP leading to a 56% increase in revenue and a higher share price.
As reported by Sophie Vorath on Friday, the AER had a big win in respect of South Australia in front of the Australian Competition Tribunal [ACT]. This removes some potential upside from the SKI share price although as SKI stated it won’t impact its existing forecasts. The AFR reports the AER is considering whether to use the ACT’s latest decision to make a fresh submission to the Federal Court in regard to the long-running Ausgrid decision. We read that the ACT has a new Chairperson, and that this might explain why the ACT found in favour of the AER in South Australia, but in favour of Ausgrid in NSW. A cynic might also be tempted to note that the increasingly loud murmurings of Government dissatisfaction with the ACT decision in regard to the NSW distributors may have had some impact on the AER’s success in South Australia. In our view though the entire approach to regulation, ring fencing and the separation between distribution and generation is outdated. Meantime though consumers look to be regaining the upper hand.
Share Prices


Volumes

Base Load Futures

Gas Prices

David Leitch is principal of ITK. He was formerly a Utility Analyst for leading investment banks over the past 30 years. The views expressed are his own. Please note our new section, Energy Markets, which will include analysis from Leitch on the energy markets and broader energy issues. And also note our live generation widget, and the APVI solar contribution.


