The scoreboard and the judges
Here at ITK we try to deal with evidence based analysis. We make forecasts and revise them often. The key issue over the next 12 – 24 months is that consumers big and small are going to see 20% increases in their electricity bills.
The gross cost to consumers will be around $9bn. Yes, you read that right – $9 bn. Who, if anyone, are they going to blame? Will they blame the current Federal Govt, on who’s watch this has occurred?
Will they blame State Govt’s for renewable policies, even though one of the biggest increase is in NSW where there is little large scale renewable energy to speak of?

Indeed, as our estimates show in the table above, NSW is facing an increase in wholesale electricity costs of $3.7 billion, adding potentially 21 per cent to household bills and 29 per cent to large business bills.
The rises for NSW and Victoria are also significant. The lowest rise, in terms of absolute cost and percentage rises in bills, is in South Australia, and that is because of its high level of renewable energy.
As is often stated by virtually every independent and or expert commentator (including us here at ITK) energy policy is an awful mess. There is even a question of who has responsibility for the policy. Is it Federal or State Governments?
The reason why prices are so high is blindingly obvious. Supply has reduced against flat or slightly increasing demand.
Federal Govt’s supply policy is the RET. That’s a bad scheme. An emissions intensity scheme has been ruled out, but in any event is still “an economist” scheme rather than providing certainty.
State Govt sponsored reverse auctions will without a doubt lead to new supply and help consumers but we think the State Govts have been far too slow.
South Australia itself has done nothing except hold tenders that result in no action. Even in Victoria the new supply is slow relative to how imminent Hazelwood’s closure is. The QLD Govt hasn’t even got to the final part of the “Mugglestone Report” yet let alone getting out and tendering for significant new supply.
NSW is nowhere really. It has a better budget than all the other States put together but just isn’t putting the effort in to look after energy security and keep prices down for consumers.
The only potential bright spot for consumers and the prices they pay is if the AER wins its Federal Court Case against the Australian Competition Tribunal over network costs. That decision must be reasonably imminent and consumers can but hope for the best.
Turning to the weekly action
- Volumes : were down this week v last year reflecting a return to better weather. NEM wide volumes remain up 4% YTD lead by NSW and QLD
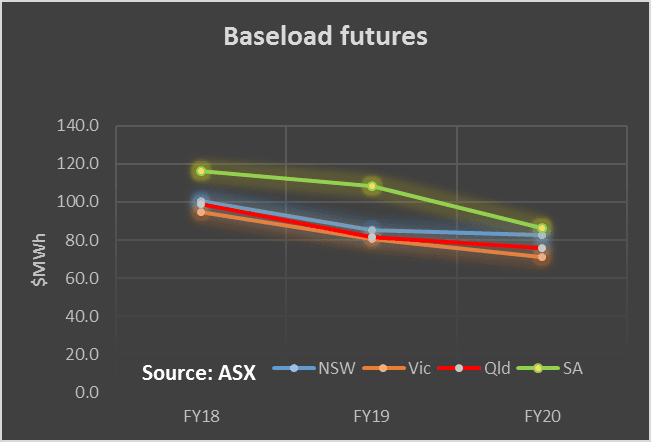
- Future prices:. Unsurprisingly but shockingly FY18 futures in NSW and Victoria rose a further 7% in one week. FY18 futures prices are now around $100 MWh across the NEM and although there is a $15 MWh drop to FY19 those prices also increased. The point is there is no need to talk about prices going up with more renewables. They already have gone up.
- Spot electricity prices were mixed but down on last week. QLD averaged $122 MWh and South Australia $86 MWh. Once again these prices reflect supply and demand. Its futures prices that matter for customer bills for the most part.
- REC prices fell a touch but this is just notional. There is still next to no reported trading.
- Gas prices were also down this week about 10% on last week to around $10 GJ. These prices are crippling for gas generation
- Utility share prices: the main action in the past week was from Genex which has achieved financial close on its ARENA assisted50 MW Kidston solar farm. GNX arranged that without raising more than $5 m in fresh equity. So that was a good effort. ORG also reported its results for the December half last week and as far as the “Energy Markets” or utility segment wen the results were dull. Ebitda increased from $721 m to $734 m. Customer numbers were essentially flat. Backing out a shut down of Eraring which ORG estimated cost the company $41 m results would have been more comfortably up. ORG has signaled that H2 (the June half) will be negatively impacted by the high power prices in Qld in Jan and Feb. Overall the trend is probably ok but in our view ORG still doesn’t have an electricity strategy that convinces.

Share Prices


Volumes

Base Load Futures


Gas Prices

David Leitch is principal of ITK. He was formerly a Utility Analyst for leading investment banks over the past 30 years. The views expressed are his own. Please note our new section, Energy Markets, which will include analysis from Leitch on the energy markets and broader energy issues. And also note our live generation widget, and the APVI solar contribution.