
The world’s renewable electricity capacity is set to rise sharply over the next five years, the International Energy Agency (IEA) says, expanding 43% on today’s levels.
The forecast – a significant upwards revision of the IEA’s renewables projections last year – is largely driven by increasing expansion of solar energy in China and India, says the Paris-based organisation.
The global dynamics of renewables expansion will also shift over this five-year period, with capacity growth in India overtaking that of the EU for the first time.
Renewables accounted for almost two-thirds of net capacity additions in 2016, with almost 165 gigawatts (GW) coming online, the IEA adds. A further 920GW of renewable capacity will be installed by 2022, according to its forecasts.
Carbon Brief breaks down the IEA’s numbers for 2016 and the main elements of its renewables forecasts for the next five years.
Solar king
The revised IEA forecast comes after additions of solar PV capacity last year topped those of any other fuel, surpassing coal for the first time.
As the graph below shows, newly added capacity reached 74GW in 2016 – up almost 50% from the amount added a year earlier. In total, renewables provided a record two-thirds of global net capacity additions.

The sector has also seen record-low auction prices of $30 megawatts per hour (MWh), the IEA notes.
Over the next five years, the IEA expects solar to represent by far the largest yearly capacity additions for renewables – well above wind and hydro.
Worldwide, solar PV capacity will hit a total of 740GW by 2022, more than the combined total power capacities of India and Japan today, it says, driven by continuous technology cost reductions and unprecedented market dynamics in China due to policy changes.
It’s worth noting that this new projection for solar PV revises forecasts up by over a third compared to the IEA’s forecasts last year (see below for more on this).
“Undisputed leader”
China accounted for almost half of the solar PV expansion in 2016, the IEA says. As the chart below shows, this was a large increase on its annual additions in 2015.

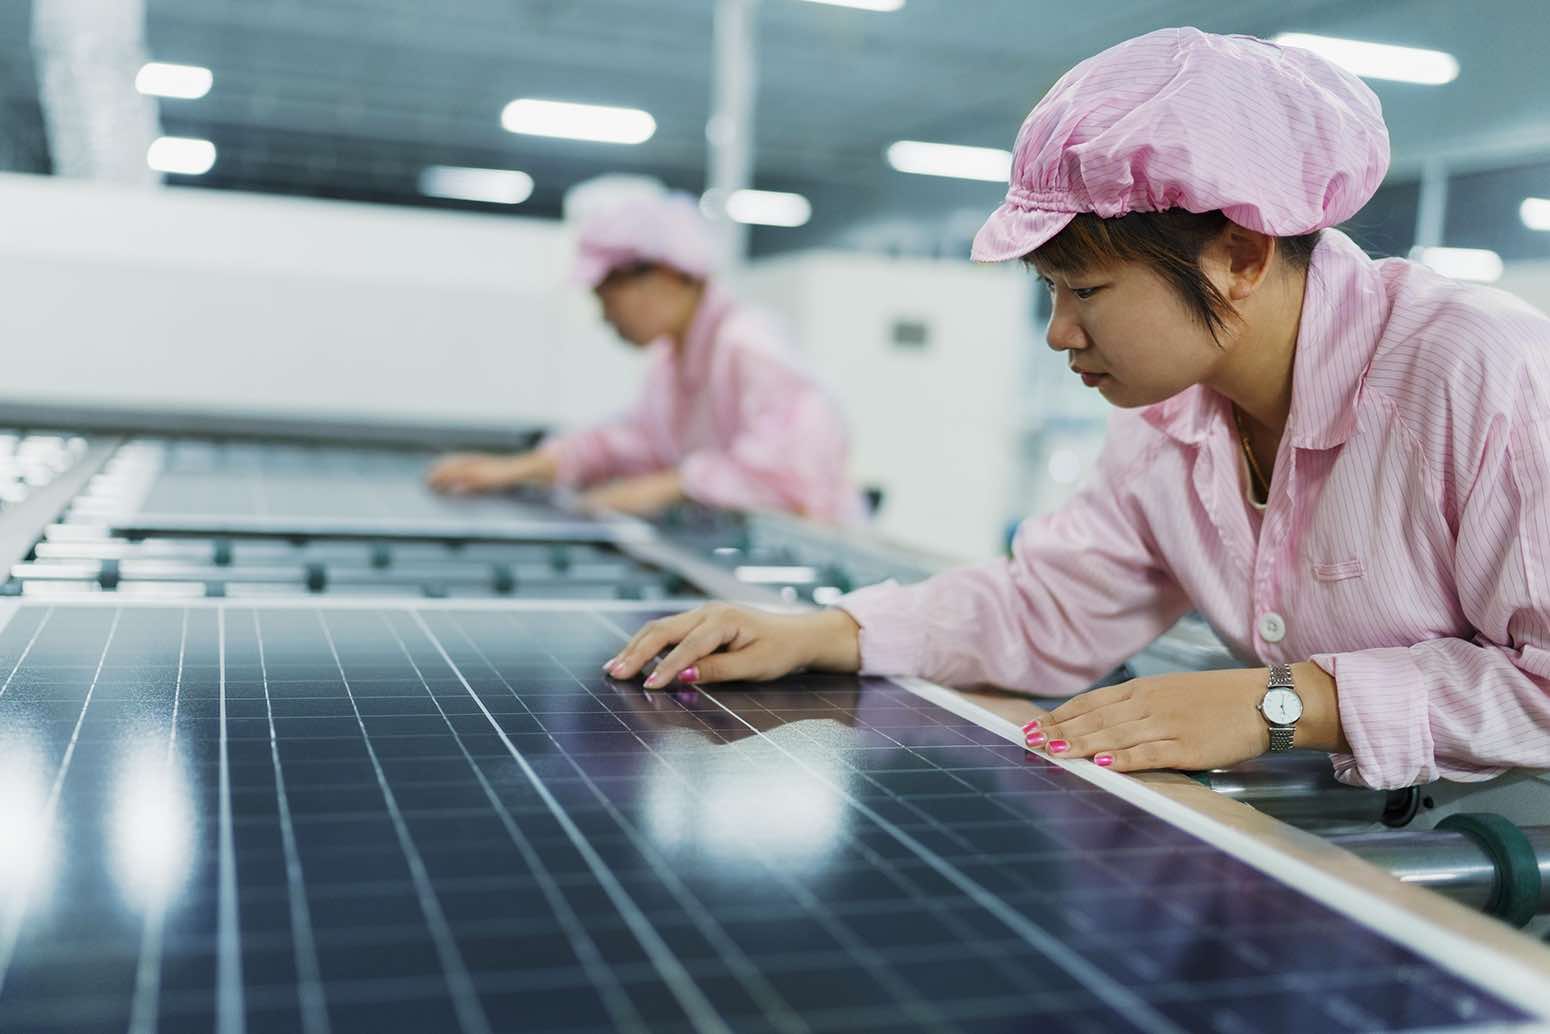
Chinese companies now account for 60% of the world’s solar cell manufacturing capacity. This means market and policy developments in China will have global implications on the deployment and prices of solar around the world, the IEA says.
China has already surpassed its 2020 solar PV target. The IEA expects it to exceed its wind target in 2019. (It’s also worth noting that the IEA said in 2015 that China would likely be two years late in meeting its wind energy goal.)
Writing in the foreward of the report, Dr Fatih Birol, executive director of the IEA, says China has increased its solar PV capacity almost 800-fold over the past decade and is now the “undisputed leader” in several renewables sectors. He writes:
“Along with new policies that spur competition in several other countries, this Chinese dynamic has led to record-low announced prices of solar PV and onshore wind, which are now comparable or even lower than new-built fossil fuel alternatives.
“This is radically changing the narrative in other emerging economies, which are now looking at renewables as attractive options to sustain their development.”
Accelerated forecast
It is important to note that the IEA’s yearly five-year-forecasts have consistently underestimated the growth of renewable energy. The graph tweeted below shows how solar PV forecasts have been revised upwards each year.
The historic track record of solar PV vs the IEA: reality steeply increasing but IEA is having none of it. https://t.co/yXzcq5b5WA pic.twitter.com/jucgE8jl6O
— AukeHoekstra (@AukeHoekstra) June 12, 2017
In a recent article, Bloomberg New Energy Finance (BNEF) founder Michael Liebreichargued that the self-reinforcing nature of bad forecasts from authoritative agencies, such as the IEA, can have significant consequences for markets. He wrote:
“When the IEA and EIA [the US Energy Information Administration] say – as they did for many years after I founded New Energy Finance – that modern renewable energy will produce less than 1% of the world’s electricity many decades into the future, that deters serious politicians, investors or business people from backing them.”
Last year, Carbon Brief took an in-depth look at how the IEA’s forecasts had have been revised upwards over the past four years. Carbon Brief has updated the chart below, which compares IEA forecasts versus actual growth, to include 2017.
Graph: IEA forecasts of renewable capacity additions | Carbon Brief
Since 2015, the IEA has tried to address these shortcomings by adding an “accelerated” deployment path to its forecasts, whereby governments address policy challenges and lift barriers to deployment. In this year’s forecast, total renewable capacity growth increases by an extra 30% under this scenario, totalling an added 1,150GW by 2022. In particular, if challenges in China around the cost of renewable subsidies and grid integration are addressed, its solar PV could reach a total of 320GW by 2022, equivalent to the total capacity of all power in Japan. If these occurred along with possible policy and regulatory improvements in other key countries, such India, Japan and the US, world solar PV cumulative capacity could almost triple to 880GW by 2022 under this accelerated scenario. China is in the process of a policy transition in this direction, the IEA says; for instance, through its move away from feed-in-tariffs (FiTs), although the timing and implementation of this remains uncertain.
EU overtaken
While China and the US remains the world’s first- and second-fastest growing renewables markets, respectively, over the forecasted (main case scenario) period, growth in India surpasses the EU for the first time, as the chart below shows. [caption id="attachment_101151" align="aligncenter" width="526"]
Windfall
While wind energy continued to expand in 2016, its annual growth in capacity declined by almost a fifth compared to 2015 (a year which saw a developer rush in China). Hydropower capacity expansion was also lower than in 2015. The Chinese market declined for a third year in a row, although there was strong growth in Brazil. Despite this, hydropower will remain the largest source of renewable electricity generation in 2022 under the IEA’s forecast, followed by wind, solar PV and bioenergy. Coal will remain the largest source of electricity generation, however growth in renewable generation will be twice as large as that of gas and coal combined over the next five years. This will help renewables will close in on coal’s lead, the IEA says in 2016, renewable generation was 34% less than coal, but by 2022 this will be halved to just 17%. Overall, the share of renewables in power generation will reach 30% in 2022, up from 24% in 2016, reaching over 8,000TWh.Falling costs
A changing policy environment will support more cost-effective deployment of wind and solar, the IEA says. Global average generation costs fall by a quarter for utility-scale solar PV, almost 15% for onshore wind, and by a third for offshore wind by 2022, as competition drives down costs. The most significant policy development in recent years has been the shift from government-set Feed-in-Tariffs (FiTs) to competitive auctions with long-term Power Purchase Agreements (PPAs), the IEA adds. This is set to continue. Almost half of renewable electricity capacity expansion will come from competitive auctions with PPAs over the next five years. This compares to just over 20% in 2016. Average levelised costs of energy (LCOEs) for wind and solar are expected to continue decreasing, but to remain higher than auction prices, as the chart below shows. [caption id="attachment_101153" align="aligncenter" width="514"]
System integration
The IEA forecasts show wind and solar together representing more than 80% of global renewable capacity growth in the next five years. Denmark will likely be the world leader in variable renewables in 2022 with a 70% share, largely from wind, as the chart below shows. The IEA expects the share of wind and solar in total generation to surpass 25% in a number of other European countries, including the UK and Germany. (The UK currentlygets 25% of its power from all renewables, including hydro and bioenergy).
In China, India and Brazil, the share of variable generation is expected to double to more than 10% by 2022.
These higher proportions of renewables in electricity generation will make integrationof these variable renewables into electricity system critical, the IEA says.
This means policymakers will need to put in place ways to increase system flexibility – such as grid interconnections, electricity storage and demand-side response.
Market and policy frameworks will also need to put other measures in place, such as long-term price signals to attract investment, pricing negative externalities, and fostering a portfolio of dispatchable renewable technologies, such as hydropower and bioenergy.
As the IEA notes, variable renewables are more exposed by losing system value as their proportion in the system increases. This is because their wholesale prices will fall exactly at the moments when their production is high and demand is low.
(An article by Michael Liebrich of Bloomberg New Energy Finance (BNEF) earlier this year looked at the policy options for integrating higher amounts of renewables into electricity networks in a cost competitive way.)
The IEA expects the share of wind and solar in total generation to surpass 25% in a number of other European countries, including the UK and Germany. (The UK currentlygets 25% of its power from all renewables, including hydro and bioenergy).
In China, India and Brazil, the share of variable generation is expected to double to more than 10% by 2022.
These higher proportions of renewables in electricity generation will make integrationof these variable renewables into electricity system critical, the IEA says.
This means policymakers will need to put in place ways to increase system flexibility – such as grid interconnections, electricity storage and demand-side response.
Market and policy frameworks will also need to put other measures in place, such as long-term price signals to attract investment, pricing negative externalities, and fostering a portfolio of dispatchable renewable technologies, such as hydropower and bioenergy.
As the IEA notes, variable renewables are more exposed by losing system value as their proportion in the system increases. This is because their wholesale prices will fall exactly at the moments when their production is high and demand is low.
(An article by Michael Liebrich of Bloomberg New Energy Finance (BNEF) earlier this year looked at the policy options for integrating higher amounts of renewables into electricity networks in a cost competitive way.)
Off-grid
For the first time, the IEA’s forecasts have taken a closer look at how off-grid solar PV applications are developing in Asia and sub-Saharan Africa. This includes industrial applications, solar home systems and mini-grids driven by government electrification programmes. [caption id="attachment_101155" align="aligncenter" width="539"]
Slow moving
As well as penetration of renewables into the electricity grid, the IEA’s forecasts also look at the future of renewables in heat and transport. Decarbonisation of transport remains a major policy challenge, it says, while the next chapter in the rise of renewables will also require more work on multiplying their applications in buildings and the industrial sector. In its scenario, the share of renewables in road transport (including biofuels and renewable electricity for electric vehicles) is expected to increase only marginally, from 4.2% in 2016 to 4.8% in 2022. [caption id="attachment_101156" align="aligncenter" width="520"]
Heat
Bioenergy will also lead in renewable heat consumption growth, the IEA says. It’s worth noting that almost two fifths of energy-related CO2 emissions come from providing heating and hot water to buildings and industrial processes. [caption id="attachment_101157" align="aligncenter" width="523"]