Every Australian household is aware of just how much electricity bills have risen in the past five years. They have effectively doubled, driven almost entirely by soaring network costs – the result of building a grid for demand forecasts that were never met.
And the reason they were never met is because the energy industry scoffed at two major innovations – energy efficiency and rooftop solar. Consumers ended up paying billions of dollars for an oversized network, in anticipation of demand peaks that never eventuated.
A new study from researchers from the Melbourne Energy Institute and RMIT in Victoria – titled Five Years of Declining Annual Consumption of Grid-Supplied Electricity in Eastern Australia: Causes and Consequences – has highlighted how demand has been reduced in the last five years.
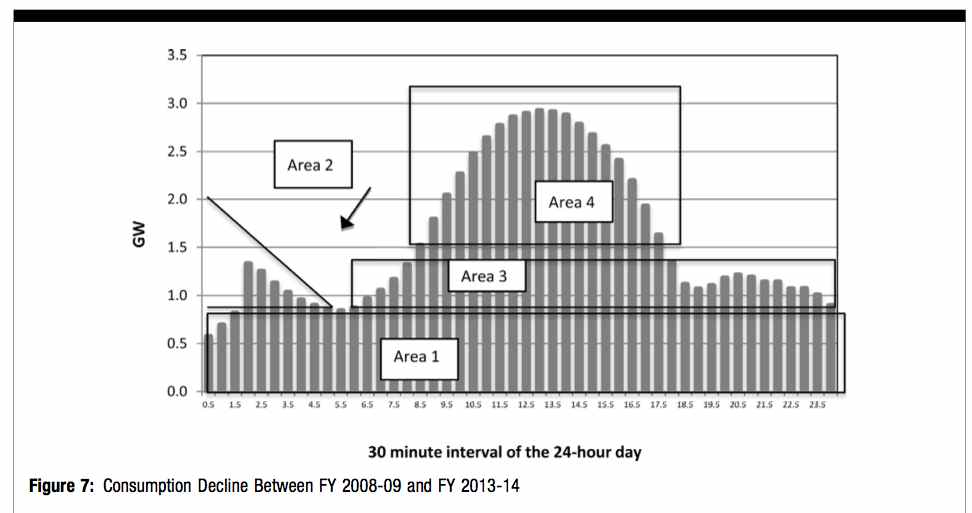
The authors note that there has been an overall decline (reflected in area 1), as a result of energy efficiency measures and behavioral change that apply during all hours of the day, as well as large-scale industrial closures, and constantly loaded embedded generation.
That accounts for around 1GW of reduction on average. In the early morning, from about 2am (area 2) there have been demand reductions of nearly 1.5GW due to the phasing-out and/or improved efficiency of resistive-electric ‘‘off-peak water heaters’’. Remember, these were introduced to keep the coal-fired generators busy during the night.
The biggest declines, however, come in area 4, where solar PV plays a major role. This has knocked up to 3GW off demand in the middle of the day.
Indeed, since the big push into rooftop solar PV by Australian households – there are now 1.44 million households with a total of 4.4 GW of rooftop solar – there have been no more “super peaks” in electricity demand.
The highest peaks all occurred between 2009 and 2011, and in the middle of the day or mid afternoon. These peaks are now covered by rooftop solar, which in most states has pushed the average peak into the evening. This is one of the unsung, and unrewarded, benefits of rooftop solar PV.
“One reason why no new records have been set since 2011 is because the deployment of rooftop solar PV has reduced maximum demand for grid-supplied electricity during midday hours,” the authors note. “Solar PV has also shifted the time-of-day at which maximum demand might occur until later in the day.”
In total, the authors noted that in the five years since 2009, annual electricity consumption in eastern Australia has declined by 7 per cent, even while the Australian economy grew by 13 per cent.
As the graph above shows, even as recently as 2011, declining consumption was not forecast by the planning authority nor by market participants. (Compare the dotted line forecasts of 2011 with the hyphenated line at bottom right for 2014). But consumers are still paying for those inflated forecasts, and will continue to do so.
This is having major consequences for incumbents, trying to pass on excessively high prices (Australia’s electricity costs are among the highest in the world), while new technologies such as solar PV, battery storage, and smart software offer cheaper alternatives.
The problem facing policy makers and regulators is that in response to overbuilding of electricity infrastructure and declining use of the infrastructure, industry incumbents are trying to reverse energy efficiency, renewable energy, and climate change mitigation programs.


