Wind energy had a good run in Denmark over the weekend, with the nation’s wind farms at times generating enough electricity to meet demand over the course of Saturday, November 26.
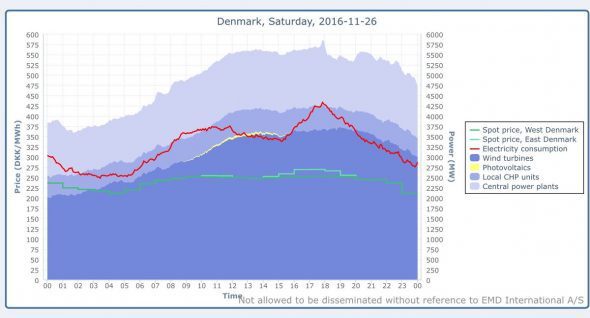
As you can see in the chart below, taken from Danish website energyTRADE, the darker blue wind energy generation kept in sync with electricity demand – the red line – throughout the day on Saturday, on a couple of occasions matching it in the early afternoon and throughout the evening.
It is also interesting to note the price comparison between the various generation sources, with wind ranging from 200 Danish Krone per megawatt-hour ($A38/MWh) to a little over 350 Danish Krone per megawatt-hour ($A67/MWh), while the nation’s central power plants range in price between $A73/MWh – $111/MWh.
 Denmark – a world leader in both onshore and offshore wind power development – aims to have wind supply 50 per cent of electricity consumption by 2020. In 2015, wind energy supplied 42 per cent of domestic electricity consumption.
Since installing the world’s first offshore wind farm in 1991, the country has installed a total of 1,271MW offshore wind, which combined with its onshore wind capacity amounted to 5,070MW as at January 2016.
To reach its goal of 50 percent wind power by 2020, the country has an initiative to deploy an additional 1,000MW of offshore and 500MW of nearshore wind turbines, as well as to replace old onshore wind turbines with new higher-capacity ones.
As RMI Outlet’s Laurie Guevara-Stone has noted, part of Denmark’s success with wind energy comes from various government regulations aimed at boosting public acceptance of the technology.
These include the compensation of residents if a property loses value due to wind turbines; giving the local community a payment per megawatt-hour of power generated; and requiring at least 20 per cent of shares in a wind farm be offered to local residents.