We are writing a couple of notes looking at the generation price outlook for both baseload and firming capacity under present policies, never mind endless Federal political machinations.
We think that the new renewables being built, recommissioning of some gas plant, and Queensland Government policy will lower baseload prices in Qld, NSW and particularly Victoria.
In Victoria, open cycle gas is used today for baseload purposes. The new supply, particularly Stockyard Hill, will see gas going back to a peaking role and not much more supply is needed to get rid of it (on an average basis) altogether.
That won’t do much for carbon emissions but it will be massively helpful to price. In South Australia, though, gas will still set the price much of the time.
The second of these notes will hopefully look more closely at the need and potential value of investing in more firming capacity in today’s world.
As only 9% of electricity in the NEM today comes from wind & solar PV, on the face of it it’s going to be hard to justify building too many pumped hydro or solar thermal plants. They are an investment in a future which we are still only walking towards.
Building for the future, not today
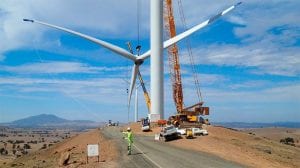
With the economics of wind and PV well established and backed up by 6GW, or $12 billion of recent investment, it’s clear there is going to be a lot more renewable energy.
The financial market questions that arise from this are not about energy security or decarbonisation, important though those topics are. No, they are the more prosaic questions: 1. What does it mean for base load prices? And 2. Is there any reward for building firming capacity?
Good answers to these questions will help financiers to see the likely reward for building more new capacity. However, it will also help to answer questions around existing assets. For instance, what is the value of Snowy? What is the value of Loy Yang B? Both of these assets or stakes in them are likely for sale.
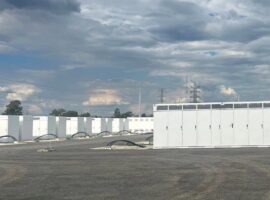
By firming capacity we mean “pumped hydro”, “solar thermal” and “lithium storage” or even new gas peakers. Alternatively a new ~$1 bn transmission line could be built to Tasmania to enable the NEM to better access Tasmania’s extensive already built existing hydro resource
In our view, it’s not clear that – with a couple of exceptions – there is a sufficient reward to justify much new investment. In our view there is very extensive firming capacity already existing in the NEM in the form of Snowy, Tas Hydro, existing gas generation and existing coal generation.
Some market evidence for this is in the price of “caps” that is the insurance product that guarantees the buyer that the buyer won’t pay more than $300 MWh for a specified number of MW over a given period.
However, in order to think about the value of new firming investment we start by looking at the outlook for baseload. As such this article will be broken into at least two parts.
New investment in process
Our latest sums show 6GW of new generation investment is underway or commissioned in 2017 onwards. These numbers are well in advance of most of the formal modelling reports, but thanks to Reneweconomy’s research we can be ahead of the pack.

Our under construction numbers still include Horncastle stages 1&2 even though these projects are now commissioned as we are looking at the change relative to 2016.
We anticipate mainland NEM wind and PV penetration to reach in excess of 17% share of total electricity supply by the end of calendar 2018 although wind capacity has a way of not always doing what it’s supposed to.

We say in excess because this clearly is not the end of the renewables investment. The Victorian and Queensland State reverse auctions have yet to take place. They should be good for close to 0.8GW of capacity assuming they come from projects yet to reach FID (financial close).
In addition, we think there is a significant number of NSW and Victorian projects that are to some extent held back by lack of easy access to transmission. In fact, we think new transmission investment is the key to seriously getting the renewables scene going in the NEM but that’s for another day.
More than 800 MW of gas will be back in operation
Under current rules we don’t expect any significant curtailment of renewables production and once built the variable cost is close to zero for wind and PV. In other words all that production is going to be dispatched.
In addition to the new renewables we also have other factors driving down price.
- Recommissioning of Swanbank E 385 MW of combined cycle gas in Qld;
- AGL 250 MW fast build/fast start reciprocating engine project on the TIPS A site in South Australia although possibly not in operation until FY20
- Recommisioning of 100% of Pelican Point 485 MW combined cycle in South Australia (this alone will make South Australia secure in my opinion)
- Queensland Govt directing Stanwell Power operator of 3.3 GW of Queensland coal generation plus Swanbank E to put downwards pressure on prices.
Electricity futures, unlike oil or other storable commodities are indicative
The question in financial markets is always whether to see the futures market as an indication of prices in the future or as just an arbitrage.
Unlike oil or gas though, electricity can’t be stored (I know, I know …) and so the futures prices is actually an indication of where the markets are going to go as opposed to an arbitrage between the cost of storage and the present price.
We exclude South Australia as small and Queensland as a special case driven more by the Queensland Govt than market forces then we can look at the average of Victoria and NSW (62% of NEM demand) as follows:

FY18 futures are up $66 MWh from a $48 MWh base a year ago, but FY19 futures are up a smaller $41 MWh from a $49 MWh base and FY20 futures which are almost liquid enough to trade are at $80 MWh and even less at $34 MWh.
However, a year ago no one was forecasting that FY18 futures were going up $66 MWh so the futures prices are not necessarily a guide. We argue that $20 MWh of the increase was driven by the decision to keep the Portland smelter running when market expectations were for closure. Replacement of Hazelwood with largely gas fired power has contributed to the rest.
State level aggregate demand supply balance adjustements
Across the States we expect some significant changes in the demand supply balance.

We allowed relatively low capacity utilization at Swanbank and Pelican Point. Gas prices are high and the plants will only be run grudgingly.
Also in South Australia we have not adjusted for pre Dec 2016 production from Hornsdale or the Northern production in Cal 16. We assume new renewable supply will replace gas in South Australia and Victoria lead to no net change in export/imports It also looks as if there will be a significant increase in net exports to NSW from QLD.
Overall we infer from the date there will be a 2% net increase in supply of 4 TWh in 2019 relative to 2016. For simplicity we assume the increase in distributed PV offsets any increase in demand and just look at utility. However when we come to price we will see that simplification won’t do.
We also need to consider:
- Impact of higher gas prices;
- Changes to market structure
- Impact of intermittency
Its only been 75 days since Hazelwood shut down. A comparison of generation market share by fuel for the combined NSW, QLD, VIC, SA market compared to the same 75 days last year shows that gas and hydro have gained market share at the expense of coal. Wind output is down significantly in both South Australia and Victoria which we assume is due to wind conditions as there is 200 MW additional capacity.

If we focus in on Victorian supply by time of day Fig 7 below shows the remaining coal is totally flat supply and how gas is now going virtually 24 hours a day with hydro supplying the morning and afternoon peaks. These are average half hourly numbers and obviously vary from day to day.
Open cycle gas is now performing base load duties in Victoria.. On average wind supply in Victoria is relatively constant by time of day.

Half hourly prices show duck curve but not much demand for extensive time shifting

- The impact of PV on middle of the day prices is now very visible. Much more so than a year or two ago. Its shoulder season so this impact will be more pronounced in Summer.
- The $160 MWh for South Australia at midnight is due to controlled load hotwater. Surely these days it would be better shifting that load to the middle of the day?
- The average duration for peak pricing is relatively short, in Qld maybe an hour in the morning and maybe 2 hours in the evening. In Victoria maybe 2 hours in the morning and an hour at night. These are average numbers but if you build a pumped hydro plant you want to run it every day as its purpose is to shift load.
- We think there is plenty of opportunity for Stanwell to lower prices further in Qld. Recall that QLD demand is actually flat or even down a bit compared to a year ago because of the reduction in Gladstone aluminium smelter output.
Post the renewables build
ITK doesn’t have access to the fancy modelling tools of Jacobs or Frontier economics. We don’t have a “Whirlygig” or “Prophet” or “Strategist” program so we have to take a much simpler approach which is nothing more than some rough guesses.
Our view is:
- Expanded PV production in Qld will result in less gas use in the middle of the day and more middle of day exports to NSW
- Those extra exports together with higher wind production in NSW will mean that NSW coal generators will cut back their production. Prices in NSW and QLD will ease a bit as a result.
- In South Australia gas will continue to set the price. Fig 8 below shows our estimate of average output by time of day post the build out of a further 100 MW of Hornsdale, Lincoln Gap, Tailem Bend & Bungala and a recovery in wind ouput to more normal levels.

On average gas is still used every half hour so it continues to set the price. However, midday prices will fall significantly. But if you want to assume that some of the gas is Pelican Point and it runs in an efficient, combined cycle shoulder mode, the average cost of the gas fired generation could reduce. As stated this baseload analysis is based on averages and makes no allowance whatsoever for wind volatility.
- Finally in Victoria on the current numbers and before the reverse auctions are implemented we see that Stockyard hill and the PV projects already announced will largely eliminate expensive gas. By the time reverse auctions are done gas will be gone and renewables will be eating further into carbon intensive brown coal

The next article will deal to the implications for investing in firming plant and what that might mean for assets like Loy Yang B and Snowy.
David Leitch is principal of ITK. He was formerly a Utility Analyst for leading investment banks over the past 30 years. The views expressed are his own. Please note our new section, Energy Markets, which will include analysis from Leitch on the energy markets and broader energy issues. And also note our live generation widget, and the APVI solar contribution.


