South Australia’s energy market continues to provide fascinating viewing for energy nerds, large energy consumers and vested interests since the exit of the last coal-fired generator just over a fortnight ago.
On Sunday, wind energy exceeded local demand for more than 10 hours, from 1.40am to just before midday (11.55am), with a peak of 120 per cent of demand at 4.30am. (See graph below, courtesy of Melbourne Energy Institute).
Of course, this does not suggest that wind energy is about to provide 100 per cent of the state’s energy needs all the time, or even average out over the whole year.
That level currently stands at around 40 per cent, but it does highlight the possibilities, particularly with more wind energy projects in the pipeline that could more than double the current capacity, and push for the need for more inter-connectors to other states.
And the wind supply – while predictable – is variable.
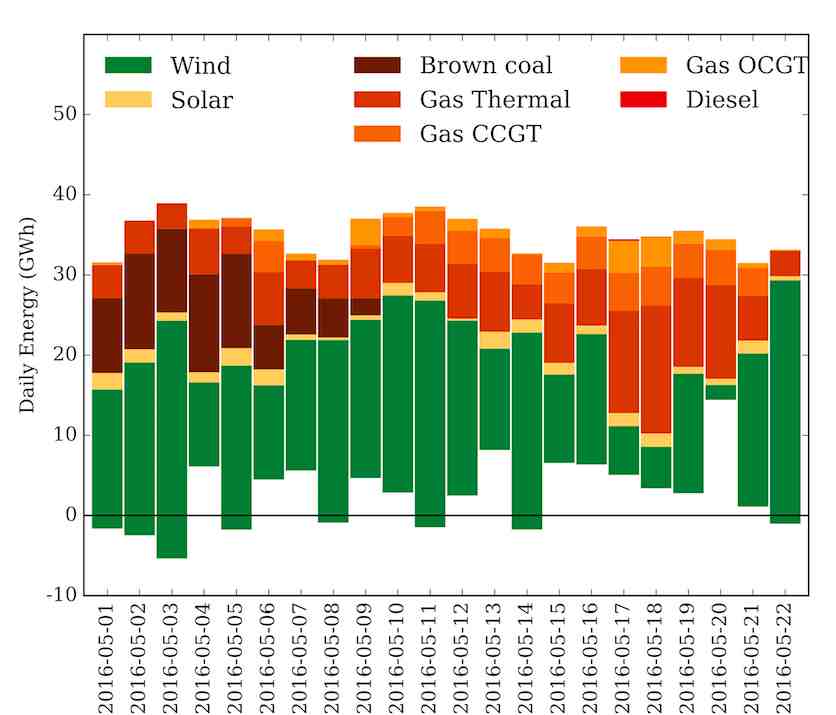
As this graph below illustrates, while South Australia has enjoyed reasonably strong wind conditions over the past two weeks, its 1,500MW of wind capacity contributed little on Friday, resulting in more than 1,000MW of gas-fired generation for a time, and for prices to shoot skywards.
Indeed, one of the things to watch in South Australia is the movement of wholesale prices. South Australia has the most volatile prices, partly because no other state has such big swings in demand, and because it has just a few dispatchable generators serving the market, which is more than two-thirds supplied by two players.
South Australia has historically had the highest prices in Australia, thanks to that volatility, and it’s reliant on expensive gas. So what’s interesting to watch is the comparison between South Australia and Queensland, the other state most reliant on gas as the marginal cost of generation.
While gas is used to fill in the gaps between wind and solar in South Australia, it is used in Queensland to fill the gaps between the output of coal and system demand, minus the input of 1.5GW of rooftop solar. Queensland, apart from a few biomass power plants, has no large-scale renewable energy generation.
In the past two weeks, South Australia’s average daily price has been cheaper than Queensland’s on eight days out of 14. These next graphs give a different view.
Those days mostly correspond with low wind days (see graph below) – May 13, 17, 18, 19, and 20. On the days with lots of wind, the South Australian price is often well below that of Queensland.
This next graph should be viewed in comparison with the one above. This one shows the average daily energy supply in 2015. The white space below the green represent imports from Victoria. It seems that South Australia, even with the local brown coal generators switched off, is importing less than it did at the same time last year.
Note: Thanks to Melbourne Energy Institute for the graphs, sourced from NEM data.


