- For the week ended July 29
- Volumes : NEM wide volumes were up 1% for the week, lead by a 7% increase in Queensland with NSW and Victoria flat. Calendar year to date (CYTD) volumes are flat
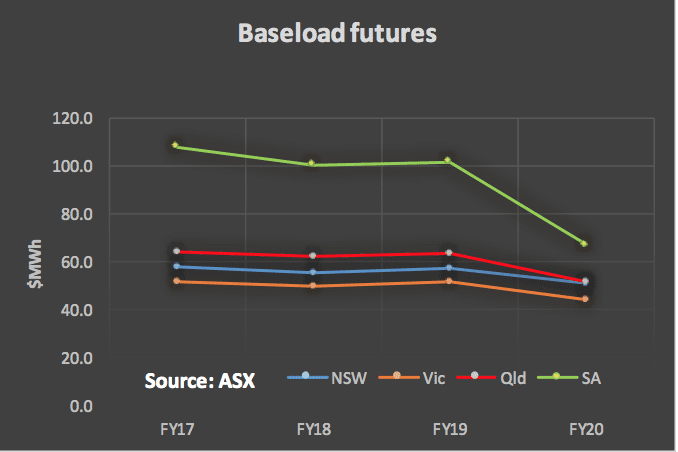
- Future prices: Fiscal year (FY) 2017 baseload futures fell 3%-4% in all States over last week and FY18 was down 1% except in South Australia
- Spot electricity prices:. Spot electricity prices averaged $37 in NSW, only 4% above the previous corresponding period (pcp) and below VIC. Sth Aust spot prices were $34.5 and we look forward (not) to press articles talking about how prices have fallen and how it’s all renewables fault.
- REC (renewable energy certificate) prices were unchanged once again and we continue to call for the RET scheme to be replaced by reverse auctions. Even in the USA the PTC may be a year by year proposition but any project financed using the PTC knows the benefit over the project life. We were heartened to hear several experts talk to the importance of the WACC in renewable energy prices and noting that the higher the certainty and confidence the lower the WACC.
- Gas prices : Gas prices were up for the 7 days in NSW over last week but fell in QLD and SA. Prices are still well above last year. Next Winter will likely be worse.
- Utility share prices:. The more speculative end of the Utility share prices was generally softer and the broader share market did better than most utility shares. The exceptions were AGL and the major yield focused utilities DUE (Duet), SKI (Spark) and AUS (Ausnet). If short term interest rates are cut this week yield will remain in demand. That said its bond rates that need watching rather than short term rates. ORE (Orocobre) shares were soft this week again on concerns of increasing supply from competitors. We continue to expect it will be a wild ride in the lithium market.

Share prices


Volumes

Base load futures


Gas Prices

David Leitch is principal of ITK. He was formerly a Utility Analyst for leading investment banks over the past 30 years. The views expressed are his own. Please note our new section, Energy Markets, which will include analysis from Leitch on the energy markets and broader energy issues. And also note our live generation widget, and the APVI solar contribution.