How correlated is the wind output from the various states?
At the moment, South Australia supplies over 40 per cent of the wind powered electricity in the National Electricity Market with Victoria next in line. As we move to higher renewable penetration, the question arises as to how correlated the wind powered electricity in NSW, Victoria and Tasmania will be with that of South Australia?
If it’s very correlated, then the issues that are evident in South Australia will become NEM-wide issues. On the other hand, if the correlation is low, then as we diversify the wind fueled electricity by geography we will tend to get a less intermittent wind supply from a NEM-wide perspective.
Figure 1 below shows some modest reduction in the standard deviation of wind over the past 14 months from a NEM-wide perspective, compared to that of any individual state. However, the reduction isn’t as large as it might be because South Australia is a large share of the total.
Looking at Fig 3 shows that NSW and Tasmania are much less correlated with South Australia and as the wind output in those two states grows, its probable the overall NEM-wide volatility will fall.
The new wind farms in the north of NSW will probably further help with that diversification.
Even so, at this stage we still think that “demand driven” renewable energy, as opposed to “availability driven” renewable energy, would be a great help. At the moment the main options for this are CSP, lithium-ion battery storage, pumped hydro storage and – less realistically – geothermal.
Of those technologies, it’s lithium-ion battery storage that plays the best with the other technology trends of microgrids and disruptive consumer-led competition. Still, lithium’s got a lot of work to do, as we will see in the next article.

Wind can supply 80% of the NEM electricity needs
As previously noted, the academic consensus is that, in Australia, the lowest-cost way to a 100 per cent renewable market has wind supplying about 80 per cent of the energy.
Those studies are based on using 2010 electricity demand (half-hourly basis) plus wind speed and other weather related data from that year, together with a set of cost and technical parameters for renewable energy sources. We quote, again, from recent literature on the technical viability and economics of a 100 per cent renewable NEM grid:
“How can we achieve lower cost 100% renewable systems?
UNSW’s modelling suggests that achieving 100% renewable portfolios at the lower end of the projected cost range will likely require the following measures:
- Enable significant wind generation – The lowest cost portfolios consistently include significant quantities of wind generation (supplying up to 80% of energy). Portfolios with lower proportions of wind are feasible, but generally more expensive. “
Source: 100% renewable literaure review UNSW
We don’t think that’s the last word to be said on the subject and we think the falling cost of lithium-ion battery technology may change some of the parameters. Still, right now, wind is fully in the mix.
Wind currently produces about 10.4TWh of electricity in the NEM – close enough to 6 per cent of total electricity demand. Of that, about 41 per cent comes from South Australia and 31 per cent from Victoria.
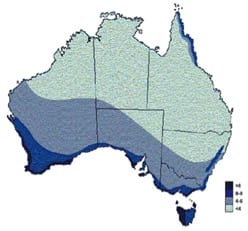
A map of the wind resource in Australia suggests that QLD is unlikely to be a major supplier of wind fueled electricity in Australia. The map below is more than 10 years old and more is known today, but still, in the end, there is just a limited wind resource close to the load in QLD.
Just by looking at the map it wouldn’t be hard to imaging that there will be some correlation between wind farms built in South Australia and those built in Victoria and Tasmania.

One thing to note is that wind turbines built today are designed to take much more advantage of lower wind speeds. And although it doesn’t look, on the above map, as if there are many spots to build wind farms in QLD, there are bound to be a few.
Cross correlations are high but still show benefits
The table below shows that NSW’s correlation with South Australia is just 34 per cent over the past 14 months. And that’s even allowing for all NSW wind to be in the Goulburn/ACT region. Building wind farms further north would likely reduce that further. On the other hand, and unsurprisingly, the correlation between South Australia and Victoria is 65 per cent. The correlation between Tasmania and South Australia is just 10 per cent.

These numbers suggest that building out wind farms in NSW and Tasmania would likely have the most impact on reducing the volatility in NEM-wide output.
Wind farm developers more interested in impact of wind on pool prices
As has been well documented, when the wind blows in South Australia the pool electricity price falls. The increase in supply drives down the price.
However in NSW wind is, at present, a very small part of the generation mix. So for the time being a greater amount of wind will only have a small impact on the pool prices in that region.
NSW is presently the largest source of load, followed by Queensland.
As time goes on, though, and as decarbonisation/falling cost of wind makes it, along with PV, the lowest-cost technology, then wind will face an NEM-wide issue of lower prices when the wind blows.
This is the same problem that PV faces. Once we move beyond a certain point for PV it tends to drive prices down in the middle of the day, having a negative impact on profitability.
These are just two instances of the economic disadvantage of “availability driven” rather than “demand driven” supply. Please be clear, this is not being critical of renewables, just drawing attention to the economics. It’s much better for prices when supply reacts to demand.
Two ways to go
In the literature, there are three answers to the problem of matching up demand with renewables supply.
One answer is overbuilding the renewable energy source, in this case wind. This results in a lot of load shedding. That is, the wind turbines are spinning but the power goes to waste. This is presently regarded as the low capital cost solution. The way the market works today, though, it will produce very poor price outcomes for producers at high wind penetration rates. In fact we think it may not be possible to build an 80-100 per cent renewable supply using a “gross pool” in the way we do now within the NEM. That’s even before we get to the problems around REC prices.
The second answer is to store the renewable energy and turn it from an “availability driven” source to a demand-driven source.
Mostly its concentrating solar power [CSP], geothermal and pumped hydro storage that have represented the focus of demand-driven renewable supply. Now, though, we think lithium-ion phosphate has some possibilities of becoming the main partner of wind and PV. We will return to this in a later article.
The third answer is to adjust demand to match supply. Some household demand can be adjusted quite easily. However, we think that won’t really do it for the broader industrial complex.
Our world view of 100% renewables, or more correctly a fully decarbonised power system, will enable electricity to be supplied to the same degree of reliability and availability as the system today. We want renewables running aluminium smelters, and server farms.
David Leitch is principal of ITK. He was formerly a Utility Analyst for leading investment banks over the past 30 years. The views expressed are his own. Please note our new section, Energy Markets, which will include analysis from Leitch on the energy markets and broader energy issues. And also note our live generation widget, and the APVI solar contribution.


