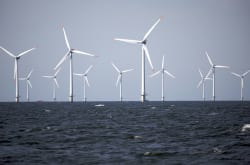
Analysing public data on offshore wind in Denmark, energy consultant Mike Parr concludes that existing offshore wind is already cheaper than gas-fired power plants. Future offshore wind farms will be cheaper still – and up to 60% less expensive than the proposed nuclear power plant at Hinkley Point C in the UK. This means, writes Parr, that government support for offshore wind can be quickly and substantially reduced.
Offshore wind is routinely criticized for being too expensive. It is true that some offshore wind farms are getting large subsidies. But that does not mean they are expensive. It rather means that their operators are making a lot of money. In fact subsidies can go down considerably and probably will, as I will show in this article.
In a previous article for Energy Post, I profiled developments in the Danish sectors of the North Sea and the Kattegat. In these two locations there are two modern wind farms: Dong Energy’s Horns Rev 2 (2011) in the North Sea and Anholt (2013), another Dong project, in the Kattegat. I showed that the Kattegat in particular represents a great opportunity for offshore wind, with very high capacity factors.
Just after finishing this article, the Danish Energy Agency announcedthat Dong’s Swedish rival Vattenfall had won the competition to build Horns Rev 3 (400MW) in the North Sea with a bid price of €103/MWh for 10 years. This is the amount that Vattenfall will get from the Danish government for that period. Furthermore there are plans for more farms both in the Kattegat (Saeby – 200MW) and the Baltic proper (Kriegers Flak – 600MW). The Danish offshore wind target is 1350MW by 2020.
Denmark publishes data on the monthly output of every single wind turbine onshore and offshore in the country. It also provides hourly data on the aggregate output of the offshore farms. This data facilitates a financial analysis of existing and future wind farms for Denmark and by extension for developments in the German sector of the North Sea. Note that the UK, which has the largest fleet of offshore wind turbines, does not provide any data on the production of individual wind farms, despite the extensive public support they receive.
Financial (R)Evolutions?
When we analyse the available data, we can draw some interesting conclusions about the evolution of costs in offshore wind. Offshore wind turbines already appear to be cheaper than combined-cycle gas turbines (CCGT’s), although this is not yet reflected in the subsidies that the operators get.

The table below shows the main results of my analysis. Note that Anholt has been built, Horns Rev 2 is in planning and Saeby will soon be out for tender. The estimate for the capacity factor (CF) for Anholt in a normal year is around 77%, as I have explained in my previous article, but to be conservative I have assumed a CF of 65%. Horns Rev 3 will be built near Horns Rev 2 which has a known CF of 50%. Saeby will “enjoy” a CF similar to Anholt because of its location in the Kattegat.
Note that the bid price is what the operators get from the government for 10 years. These are guaranteed payments. After that, they can sell the electricity on the wholesale market. I have assumed a wholesale price of €25/MWh for a period of 15 years after the 10-year period is over. This is obviously an estimate, since nobody knows what the market price will be 10 years from now.
I have also assumed a discount rate of 5% (cost of capital/debt) for all projects. This is based on the cost for Dong to raise bonds. Investment costs of the projects are based on statements from the companies. I have made some other assumptions with respect to operation and maintenance costs. The net present value (NPV) represents the total revenues over the 25-year period minus the costs, with a discount factor of 5%. In other words, this is the profit the project makes recalculated as net present value.
Anholt
As the table shows, Dong invested €1.355 billion in Anholt. With a capacity factor of 65%, a bid price of €140.00/MWh for 10 years, a wholesale price of €25/MWh, net present value comes out at between €763 and €1180 million. This represents an internal rate of return (IRR) of 21-25%. By year 6 the project will go (cumulative discounted) cash positive. By year ten when the €140/MWh finishes it will be €1bn cash positive.
Given these numbers it is not surprising that some Danish pension funds (PKA A/S and PensionDanmark )were keen to take part in the project! This is not to say that the subsidies were unjustified. They were probably necessary to get the offshore wind ball rolling. But the government’s support can be (and is being) reduced substantially for future projects.
Horns Rev 3 (HR3)
HR3 will enjoy wind speeds of 10m/sec typical of the west coast of Jutland (source: Dansk Energie). Vattenfall bid €103/MWh for 10 years. The average capital cost of a MW at the Anholt farm was €3.355m. However, the permit granted to Vattenfall is for WTs in the range 6MW to 10MW. These can be expected to reduce project costs and increase CFs due to the need for fewer turbines. Thus one of the financial assumptions for HR3 is that there will be a 15% reduction in costs (to €2.9m) per MW installed. Based on this, in year 9 the project goes cash positive and by year 10 is cumulative cash positive at €125m. The change in capacity factor (50% vs 65%) and the drop from €140 to €100/MWh has made a difference to the IRR and NPV.
Saeby
Denmark aims to install a further 1GW of offshore wind by 2020. It will soon be tendering for a 200MW offshore wind farm in the Kattegat near Saeby, just north of Anholt. Project costs should be around €580m based on HR3 assumptions. The project should go cash positive by year 7 and have cumulative discounted cash of €238m by year 10.
Cheaper than gas-fired power and nuclear
What is interesting to note, in addition to the high profitability of Anholt in particular, is that the Danish auctioning process seems to be successful at driving prices down (26% reduction over 5 years Anholt vs Horns Rev 3).
Even more importantly perhaps are the actual costs of offshore wind, which are lower than the bid prices. In the column “lifetime costs per MWh” I have calculated the costs for each of the three projects. This is based on the energy produced in the first 10 years of operation multiplied by the bid e.g. €103/MWh for Horns Rev3 plus the energy produced over 15 years at an estimated wholesale price of €25/MWh. This sum is then divided by the total energy produced by a given project over 25 years. Whilst this is crude, it provides some indication of a “lifetime” cost per kWh for the consumer. In the case of Saeby a simple sensitivity analysis was undertaken with the aim of matching Saeby’s internal rate of return to that of Horns Rev3. A bid price of around €90/MWh would lead to a “lifetime” cost of €51/MWh.

Recent reports such as this one by Ernst & Young on wind in Europe, while positive about offshore wind, still imply that offshore wind is expensive. According to this report, offshore wind power has a price similar to that of CCGTs. Based on the Prognos report for the Bavarian government (published in November 2014) this is around €90/MWh (levellised cost of electricity or LCOE). Anholt turns out to be 14% cheaper and Horns Rev3 around 37% cheaper than CCGT power. If the EU ETS was functioning then the differential would be even greater.
Note that the energy-only component in a Danish electricity bill for 2013 is around €48/MWh. This is close to the €51/MWh from Saeby over 25 years. Furthermore, as more projects are built costs are likely to come down further.
If we compare the offshore wind farms to the cost of the nuclear power project proposed at Hinkley Point, which will get £92.50 (about €125) per MWh for 35 years, Anholt delivers electricity that is 40% cheaper, Horns Rev3 will deliver electricity that is 58% cheaper and Saeby 60% cheaper. Of course the authorities should ensure that they will get competitive bids.
The only uncertainty in this is how wholesale prices in Denmark will evolve in the next 25 – 30 years. What is certain is that once 10 years have elapsed, the owners of Danish wind farms will be at the mercy of the markets and the wind. By contrast, owners of UK nuclear plants seem to have been granted certainty on both price and market access. Whilst the UK talks about energy markets, the socialist Danes seem to have implemented them. Funny that.
Editor’s Note
Mike Parr is Director of energy consultancy PWR. He previously worked for one of the UK’s distribution network operators as a systems engineer running their network Merseyside. He then moved into industrial engineering running the services (and energy saving activities) at Sony’s Bridgend TV plant. In the late 1990s he founded PWR Consultants which undertakes research in the area of climate change and renewables for clients which include a G7 country and global corporations.
Source: Energy Post. Reproduced with permission.


