Why electricity demand is falling, and what it means

It is a multi-generational truth that electricity consumption only increases. This is best seen in the US where, since 1949, electricity demand has marched upward in a nearly uninterrupted pattern with the country never experiencing two consecutive years of negative growth.

Even here in Australia with data going back to 1961, we have never experienced two consecutive years of negative growth either.

image
Figure 1 – US and Australia Electricity Consumption (Billion Kilowatt hours)

Electricity demand falls in USA in four of last five years

However, in the US, how is it that in four of the past five years to 2012, electricity demand has indeed fallen? In fact, the same unprecedented softening in electricity consumption is happening in many places around the world (Figure 2).

image(1)
Figure 2 –Compound Annual Growth Rate for Electricity Demand for Selected Countries

Source: Bloomberg, national statistical departments. Long term is: Australia – 51 years; US – 63 years; Japan – 20 years; Germany, France, Italy and UK – 22 years.

Why has electricity demand fallen?

While the global financial crisis and subsequently weak economic environment are partially to blame for the decline, we believe there are three other contributing factors:

1. Rise of distributed generation

2. Increasing energy efficiency

3. Behavioural changes

Distributed generation is a term to describe the shift away from producing energy near a fuel source (which is typically far away from consumers) to producing near the consumer. The best example of this is solar panels on rooftops, where electricity is produced and consumed onsite.

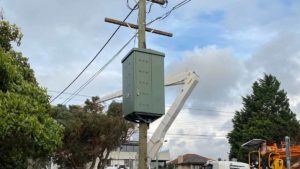
No power bill from rooftop solar panels – getting consumers off the power grid

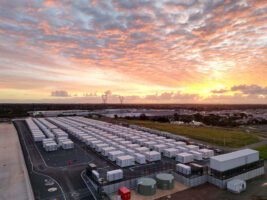
This can be extended to other forms of micro generation and energy storage, which collectively reduce energy lost from long distance transmission and harden the system against unplanned outages. Much of the micro-generation (rooftop solar panels, microturbines, fuel cells and Combined Heat and Power (CHP) units) is occurring behind the meter, meaning consumers are reducing their use of grid power. As explained by Edison International, it has seen the consumption share of industrial users in Southern California go from one-third of total electricity consumption to only 10 per cent as many installed super-efficient CHP units onsite.

Rooftop solar installations are now doing the same thing with residential and commercial electricity demand, as they swap local grid power with self generation and, in some cases, even put excess power back into the grid. Solar power and CHP units are both established technologies and within financial reach of much of the population, indicating this trend will continue.

LED light bulbs use up to 90 per cent less electricity

The most efficient watt is the one you don’t use because it uses no resources to produce it at all. This simple idea is embodied in energy efficient products and services, which is gaining significantly more attention. LED light bulbs use up to 90 per cent less electricity as a comparable incandescent light bulb. Insulation in your home immediately cuts energy bills. Recycling an aluminium can uses 95 per cent less energy than making it from virgin materials. Collectively, these efficiency measures are impacting consumption as the high cost of energy brings the issue sharply into focus for consumers and businesses. The price of energy is not going lower and, as a precious resource, it just makes sense for its use to continue to be carefully rationed.

Perhaps because conservation and the environment have become mainstream issues, utilities are telling us they are seeing behavioural differences between their younger and older customers. While an older customer would simply turn on the aircon when it is hot, younger customers are increasingly just opening a window. While their evidence seems to be more anecdotal than scientific, the Australian Bureau of Statistics noted in a recent study of social trends that four out of five people (80 per cent) who reduced their electricity usage reported this was due to efforts to conserve energy.

In contrast, saving money and lifestyle changes was given as a reason only about one in five times (20 per cent). Attitudes take a long time to form and to change but once entrenched are difficult to dislodge. We suspect a new generational trend is becoming entrenched that recognises our individual actions have ramifications for the collective.

Winners and losers in energy market

How energy is produced, transported and consumed is in constant flux due to a multitude of factors. These factors will result in winners and losers.

Just as falling electricity consumption is bad for the owner of a generator, the winners will be those companies that reduce a customer’s dependence on the grid.

Comments

4 responses to “Why electricity demand is falling, and what it means”

  1. Wayne Lusvardi Avatar
    Wayne Lusvardi

    Well, this is hardly a scientific answer to the problem because it does not falsify the options you focus on. The background to the declining energy use is a declining economy. Without eliminating that variable your discussion is not very helpful. Or take another plausible variable: age. The population of baby boomers are retiring and don’t have kids in the home any longer. The next generation isn’t producing children at the same population replacement rate as the boomers. Why energy is declining is like crime – we don’t really know why it happens but we have lots of theories and biases.

  2. Ebh Avatar
    Ebh

    The joke around here is the water company pushed and pushed for people to conserve water…you’d save money …they told us. So millions did what they were told…and water use declined and rates declined for a while.

    Now we’re seeing skyrocketing rates for the little water we use. When a local talkshow host challenged the water company and sewer company…

    They said the massive rate increases were due to “over conservation” which was causing insufficient income to maintain the systems. LOL.

    I look to reports like this about electricity and our failing power grid to also be the direct result of the ‘green agenda’ too. The unintended consequence of ‘over conservation’ that doesn’t account for a minimum of use to maintain the systems, nor the inexpensive sources that have historically made the most financial sense (ie. coal).

  3. johnnygeneric Avatar
    johnnygeneric

    There are no numbers cited. I think the vast majority of houses in CA and around the USA are still on the grid. Numbers with PV? Probably in the single digits.

    Citing LED and such as reasons for less consumption is stupid. Home lighting is a very small percentage of electric use.

    Less electricity is being consumed because people are poorer. It’s that simple.

  4. Nathan Lim Avatar
    Nathan Lim

    Valid questions/points. We will try to address them all and will be referring to the attached table. Yes, solar is a small portion of total generation but its increase is
    accounting for a sizeable share of the change in consumption. Looking at the
    first column we can see electricity consumption has fallen 67 billion kilowatthours (kWh) over the five years to 2012. Over this same time US GDP (the second column) has increased US$544 billion. If you look closely at the data, indeed electricity consumption did fall and rise with the broader economy. We are in agreement with this point, as indicated in the article but note electricity consumption is still down after five years yet the economy has recovered, in a dollar sense anyway. There is imperfect information to draw conclusions for this fall but we direct you to the EIA website (http://www.eia.gov/todayinenergy/detail.cfm?id=8510#.Ux03B0XYX58.email)
    which explains how the national statistics are NOT capturing the power production figures from households and commercial users who are installing solar on their roof (behind the meter). By their estimate, at the end of 2011 there were about 2,500MW of solar installed behind the meter with another 1,000MW installed by utilities and other large producers. Column three is the official EIA data for
    UTILITY and LARGE producers ONLY which shows a mere 3.5 billion kWh of
    production in 2012. However, given that there is 2.5x more solar installed
    behind the meter, we believe the true total production figure is at least 3.5x
    larger than the utility only figure (column four). By our estimate, we believe
    at least 18% (12.1 ÷ 67) of the decline in electricity consumption came solely
    from new solar installations. In fact, looking at column five we see that the
    US installed nearly as much solar in 2012 as the previous three years combined that
    the 3.5x adjustment factor might actually be too low. We maintain that rooftop solar is having a meaningful impact.

    In regards to lighting, we refer you to the EIA website: http://www.eia.gov/tools/faqs/faq.cfm?id=99&t=3. Lighting in the residential and commercial sector consumed 12% of total US electricity consumption. Again there is imperfect information but we know LEDs and other energy efficient bulbs consume substantially less power than incandescent bulbs. Also, the US and much of the rest of the world has been doing a staged ban on incandescent light bulbs. Given that businesses and households are being pushed into energy efficient bulbs we believe LEDs must be having an impact on consumption.

    These comments take a decidedly US-centric view of the phenomenon only because there is more data available for this country but the observations are anecdotally true for other countries as rooftop solar installations are booming in many countries and LEDs are being promoted heavily around the world. In regards to LEDs, if you live in Australia (like us) the quality, selection and price is inferior to what available
    overseas so that is why it might not seem that LEDs are a viable or popular alternative to halogens.

Get up to 3 quotes from pre-vetted solar (and battery) installers.