As an Australian who is concerned about our changing climate there is a long list of quotes from our new Prime Minister that I find irksome. But right at the top is his description of emissions trading as:
“a market in the non-delivery of an invisible substance to no one”
But before I start to eff and blind about ‘direct action’ or the acidification of the Great Barrier Reef, I wonder if Tony has a point on invisibility. Would we do more to combat climate change if we could see carbon dioxide? I have little doubt we would. Highly visual pollution like smog or algal blooms engender strong responses from people.
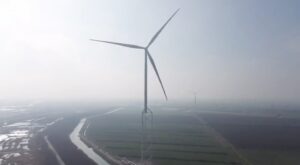
A small UK startup named Carbon Visuals has taken this idea to heart and is producing some incredible visualizations to help us grasp the vast volumes of carbon dioxide we are adding to the atmosphere. Their most famous work is a gorgeous film about New York’s emissions (a still above). But they’ve got some other wonderful stuff. Here are some favorites of mine.
US sub-grid emissions at a human scale
 Power sector emissions are a huge deal in the US, pushing 40% of energy related carbon emissions. But few people understand the sub-grid emissions outside of energy wonk circles. Carbon visuals bring it back to a human scale with a great little youtube video showing the volume of carbon dioxide produced for each kilowatthour of electricity that is generated.
Seeing how the Carbon Majors stack up

The great thing about using volumes is that there is always a familiar scale to be used. This image takes the data from the recent paper ’Tracing anthropogenic carbon dioxide and methane emissions to fossil fuel and cement producers, 1854–2010‘ and stacks them up as 5 Gt cubes onto the UK. Chevron (51,096 Mt CO2e), ExxonMobil (46,672 Mt CO2e) and Saudi Aramco ( 46,033 Mt CO2e) lead the way.
Visualizing the carbon we shouldn’t burn

This visual does a very good job of showing Tony the volume of the problem we are facing. The pink cube on the left is a rough estimate of the carbon that can still be burnt before we lock in at least 2C of warming, on the right is the carbon embodied in the know fossil fuel reserves (oil, gas and coal on top). Tragically, the cube to the left is shrinking while to column to the right is growing as knew technology unlocks even more fossil carbon.
An Empire State of Mind
New York is indeed a concrete jungle where dreams are made. And like any other big city it belches CO2, 24/7. This award winning video is about as good as carbon visuals get. If you haven’t seen it before it’s well worth a look.
As a carbon wonk interested in using images to explain climate challenges I just love this work. If you’ve got carbon story that could benefit from a third dimension, Carbon Visuals are well worth a look.
This article was originally published on Lindsay Wilson’s blog, Shrink That Footprint. Reproduced with permission. Read more at http://shrinkthatfootprint.com/visualizing-carbon#28OQ2mtyMC5owzTL.99