Graph of the Day: Solar PV’s path to 2c/kWh

Today’s Graph of the Day is a follow-up to our article on Thursday on Trina Solar, and its forecasts for the coming  years for the solar PV industry.

One aspect we touched on was the levellised cost of electricity. Trina’s goal is to bring the cost of solar PV down to around 6c/kWh, which it thinks can happen within 5 years. At that price it will be competitive with gas in most countries, coal in some countries, and new build fossil fuels just about everywhere.

But how does it get below that – to say, perhaps, the 2c/kWh mark imagined by solar research leaders such as Eicke Weber, of the Fraunhofer Institute for Solar Energy.

That’s what makes this graph so interesting. It seems to suggest that solar PV will have a natural base at some point. The biggest gains can be made in the efficiency levels. But the other key measure is the cost of manufacturing. Trina’s initial goal is to lift efficiency to an average 20 per cent and reduce the cost of manufacturing by nearly one third.

To get it much below that would require the sort of manufacturing cost reductions that might only be envisaged by the sort of multi-gigawatt plants envisaged by Weber for the EU, or even the 3GW manufacturing complex announced recently by Hanergy – although that is for thin film solar PV.

trina forecasts

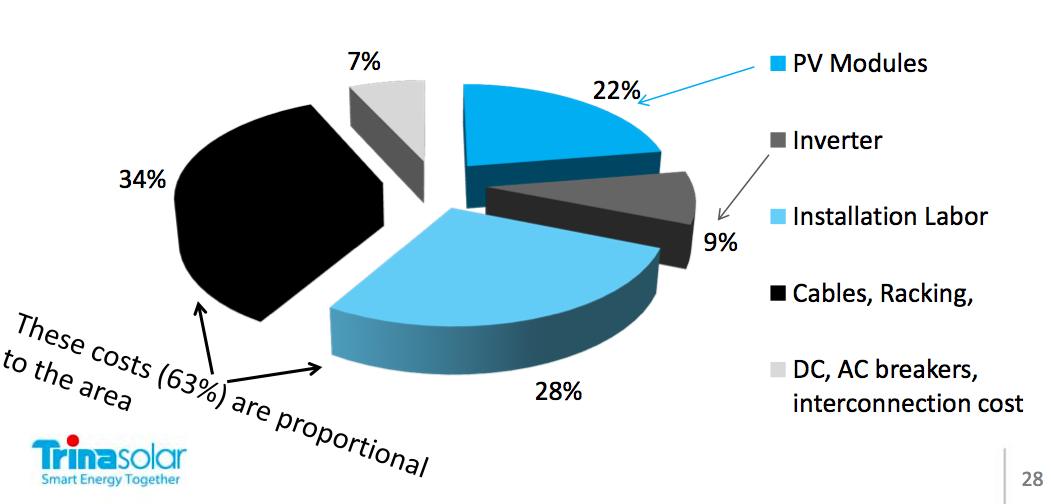
The other graph points out that even with the savings in modules, it actually only represents less than one quarter of the costs that make up the LCOE of the technology. This graph below illustrates the point – inverters, labour, cables and racking and interconnection costs make up the rest.

trina components


Comments

3 responses to “Graph of the Day: Solar PV’s path to 2c/kWh”

  1. Tommy Edison Avatar
    Tommy Edison

    Perhaps

    The current number is more like 14c to 15c per kWh with STC benefits factored in, with the potential to reduce in the near term to 10c if the STC stays, and an all in system prices at $2/W with a 15% uplift in production per unit

    the impact of system generation and system price on LCOE is shown in the table below. in constructing the table, lets be generous and assume that a system will last 25 years with an annual degradation of power output of 0.5% p.a. Further assume that the cost of capital attributable to the system is 7% (cost of equity 12%, cost of debt 6%, leverage 80%), and also assume the system costs nothing to run or own over its life.

    Further assume a 3kW system is installed in Adelaide. we could expect current tier 1 systems to deliver annual power in year 1 of say 4600 kWh per annum. that system will retail to customers somewhere (net of STC) at between $2.25 and $2.50/ Watt.

    LCOE will vary as a function of all-in system cost to the customer and the initial generation capability (kWh/a) of the system as follows:

    $1.50
    $2.00
    $2.50

    4,000
    10.13
    13.50
    16.88

    4,400
    9.21
    12.27
    15.34

    4,600
    8.81
    11.74
    14.68

    4,800
    8.44
    11.25
    14.06

    5,200
    7.79
    10.39
    12.98

    5,600
    7.23
    9.64
    12.05

    6,000
    6.75
    9.00
    11.25

    6,400
    6.33
    8.44
    10.55

    6,800
    5.96
    7.94
    9.93

    so at current market prices and current efficiency levels we might see an LCOE in the range of 13c to 15c – which is still a pretty good result

    but to get to 6c – we would need a 50% uplift in system generation and a 40% reduction in cost (assuming the STC stays) from current levels.

    Of course if one backs out the STC benefit then a 3kW system retailing for $2.50/W is really pricing at over $3/W before subsidy. so on an unsubsidised basis the whole system cost would need to more than halve in price as well as deliver that 50% uplift in performance.

    No doubt we will get there. but not yet. module cost is just one part of the story. balance of system, soft costs and return on capital are just as important.

    Perhaps the Trina numbers are based on the US sunbelt and factor in generous tax incentives which can reduce the headline cost by half.

    Trust me on this – I invented the lightbulb

    1. Tommy Edison Avatar
      Tommy Edison

      whoops – the table didn’t post too well did it? under each production number (e.g. 6,800) you can see the $1.50/W, $2.00/W and $2.50/W LCOE respectively

  2. Askgerbil Now Avatar
    Askgerbil Now

    Solar PV power may be generated at the site where it is consumed.

    In this case it is not sufficient to compare its cost with that of electricity that is generated at a remote power station. “Trina’s goal is to bring the cost of solar PV down to around 6c/kWh, which it thinks can happen within 5 years. At that price it will be competitive with gas in most countries, coal in some countries, and new build fossil fuels just about everywhere.”

    The cost of delivering that remotely-generated electricity to the site where it is consumed needs to be taken into account.

    At present the price of delivering electricity in Australia is at least 15 cents per kWh. The actual cost of delivery may be much higher; This is the argument developed by utilities that wish to introduce time-of-use charging for consumers with air conditioners.

Get up to 3 quotes from pre-vetted solar (and battery) installers.