As Germany chancellor Angela Merkel said last month, if Germany can succeed with its ambitious energy transition then other countries could too. “If we succeed, then she (the Energiewende) – and I’m convinced of it – will become another German export hit,” she said. “The world looks with a mixture of a lack of understanding and curiosity on whether and how the Energiewende (Germany’s move from nuclear to renewable energy) will succeed.
Many, particularly in the fossil fuel industry, look on with horror, rather than curiosity. A successful transition in Germany will set off a domino effect which will be unstoppable. Which is why so many – from large international coal and oil companies, all the way down to conservative commentators and even Australia ministers such as environment minister Greg Hunt, do as much as they can to suggest the German experience is a disaster.
Their main target is not just the cost of the program, but it’s supposed lack of success. The critics say it is not reducing emissions, it is not resulting in less fossil fuels, and it’s a plan courting disaster.
Last week, Craig Morris demolished a few of those myths. Today, are a few graphs from Bruno Berger, at the Fraunhofer Institute for Solar Energy Research, that demolish a few more.
This first graph shows the amount of production from the various sources in January and February (the main winter months), compared to a year ago. All fossil fuels are down, while wind and solar are the only gainers.
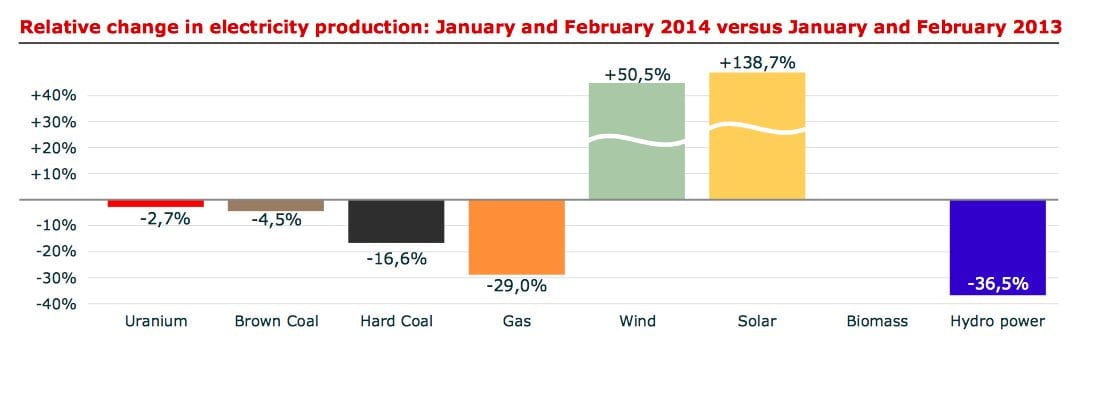
This is the same information but given as a percentage increase or decrease. Note that solar more than doubles, helped not only by an extra 7GW of capacity, but also increased sunshine. The biggest impact among fossil fuels was gas, which represents the fact that it is the most expensive marginal cost fuel, and is first out of the system under the merit order impact.
It was widely expected that closing nearly half Germany’s nuclear capacity soon after Fukushima would mean the country would become a net importer of electricity. In fact, it has never exported more, as this graph below shows.
And finally, here is the rated capacity of each fuel source in Germany as at mid-February, 2014.


