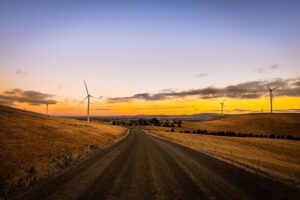
If you are looking for a growth sector in electricity generation, it is pretty clear where they are to be found – wind and solar.
Today’s Graph(s) of the Day extends our coverage of Bloomberg New Energy Finance’s new report on the outlook for renewable energy investment out to 2030. BNEF canvassed a range of scenarios – ranging from “traditional”, to “new normal” and “barrier busting” – similar to the International Energy Agency’s range of business as usual, new policies, and its 2C (meeting the science) scenario
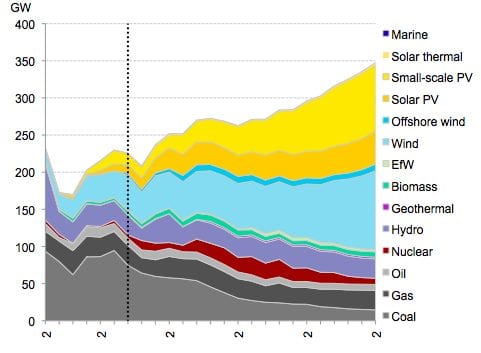
BNEF says that in its mid-scenario (new normal), 70 per cent of the new power generation capacity added between 2012 and 2030 will be from renewable technologies – with solar PV and wind will comprise the largest share of new power capacity added to 2030, accounting for 30 per cent and 27 per cent respectively.
As the cost of wind and solar falls and carbon prices and other environmental controls, increase the cost of fossil fuels in certain countries, new coal and gas capacity become less attractive, comprising only 25 per cent of capacity additions to 2030.
Nuclear also sees something of a renaissance but this is limited to 5-6 per cent of total new capacity added to 2030. Interestintly, BNEF sees little deployment of solar thermal, mostly because its construction out to 2020 at least will be curtailed by high costs. The industry will be keen to prove that wrong. All told, around $8.2 trillion or 73% of total asset finance to 2030 will be spent on renewable energy including large hydro.

In the “barrier busting” scenario, that percentage goes of new capacity from renewables goes up to 75 per cent. What is fascinating in all these tables is the prominence of small scale solar – it will account for 18-20 per cent of all new capacity – even in traditional territory scenario, it accounts for 15 per cent because of its plunging costs. If these forecasts are even remotely right, we are truly on the verge of a solar revolution in the world’s energy markets.