Electricity demand: The great de-electricifation of Australia’s grid

The Conversation

One of the certainties in the energy business used to be the regular year-in, year-out rise in demand for electricity [1].

Up until about 6 years ago, demand growth could be counted on with metronomic precision. Across our National Electricity Market – the NEM – electricity demand grew at about 2% annually.

That all stopped in 2008. On the basis of the numbers for June and July this year, we are on the verge of our twelfth straight season where demand has reduced on the year before.

Annualised seasonal demand changes for the mainland states in the National Electricity Market (NEM). Noting that latest winter figures are incomplete (2013 data includes Winter months June and July only), we are on target for our 12 straight season of demand reduction. AEMO Price and Demand data – http://www.aemo.com.au/Electricity/Data/Price-and-Demand
Click to enlarge


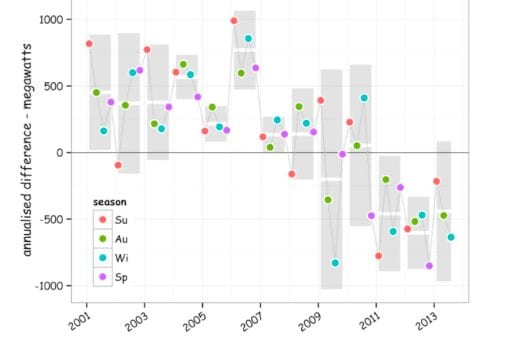
Over the last 3 years, the annualised demand reduction has been about 500 megawatts – or about 2.2%. And since the peak in 2008, average demand has reduced by about 2 gigawatts or about 8%.

On these figures, Australia is clearly undergoing a profound de-electrification. If it continues for a few more years then, by analogy with economics, it will be worthy of the appellation the great de-electrification.

To appreciate the real significance of these numbers we need to look back a few years. Because the planning for new generating plant takes many years, we are still in an investment cycle that dates back half a decade or more.

Looking back to 2007 and the outlook for electricity investment was looking rosy. In 2007 planning would have been for a generation capacity growing at 2% each year. Then forecasts were for an average winter-time demand of around 26 gigawatts.


Average demand for the winter months of June and July for the mainland states on the NEM shown in red. The green line shows the projection of the 2000-2007 growth trend of 1.8%. AEMO Price and Demand data – http://www.aemo.com.au/Electricity/Data/Price-and-Demand
Click to enlarge


That is almost 4.5 gigawatts greater than we have seen so far this winter. In percentage terms the 2007 forward projections were out by about 17%.

Projected demand deficit as a percentage, calculated as the difference between predicted demand growth on the 2000-2007 trajectory and the realised demand (for the winter months of June and july). AEMO Price and Demand data – http://www.aemo.com.au/Electricity/Data/Price-and-Demand
Click to enlarge

And the problem is that all the pointers seem to indicate demand reduction is accelerating. The latest figures for the June-July period show the largest annual reduction recorded – amounting to about 5% on those forward projections.

Across the NEM the generating capacity is a bit over 50 gigawatts, or a bit over twice the average demand.

The fall in demand is creating a tremendous capacity overhang in generation. That has significantly depressed wholesale electricity prices over the last few years.

And that is impacting industry players such as AGL, who have been recently reported as calling for a retirement of up to 9 gigawatts of generation capacity across the NEM.

That is a massive amount, representing a bit more than the total capacity of the generation fleet in the Latrobe Valley that supplies about 85% of Victoria’s electricity.

The logic for a 9 gigawatt retirement is straight forward. At about 17% of the total NEM-wide generation capacity, it is more-or-less identical with the demand reduction on the forward projections of just 6 years ago shown in the figure above.

The big question in the electricity game is what will happen to demand in the next few years. Despite industry pundits having consistently forecast return to growth for a number of years, all the signs are that demand reduction is accelerating.

Certainly the trends in the figures shown above seem to indicate we haven’t bottomed out yet. So at least for the near term the great de-electrifcation is a stronger bet than a return to growth.

If so, there will be need for very significant restructuring in the generation sector, of the likes we have never seen. In the meantime we should expect some very aggressive repositioning amongst our energy utilities.

In a normal market, oversupply should lead to some very aggressive pricing to maintain market share. The question is, how normal is our electricity market?


[1] The term “demand” is used here to refer to the average demand and so provides a measure of the total electricity demand over period of time, rather than the instantaneous “peak” in demand.

Mike Sandiford is director, Melbourne Energy Institute at University of Melbourne. This article was first published at The Conversation. Reproduced with permission.

Comments

13 responses to “Electricity demand: The great de-electricifation of Australia’s grid”

  1. Coaltopia Avatar
    Coaltopia

    The problem remains that lignite is still artificially cheap.

    1. Thylacine Avatar
      Thylacine

      Never mind the price count the cost

  2. paddybts Avatar
    paddybts

    It would be fascinating to know, to what degree, if any, the large increase in home insulation (pink bats anyone?) and the reported record warm temperatures, had in this decline of power use.

    1. Biff Avatar
      Biff

      It certainly would be. I would really like to know the precise reasons for this drop in demand and the weighting, but I guess we never will. These are the factors I could see playing a role:

      1) given the decline started in 2008, the GFC and people economising?
      2) higher electricity prices especially after the carbon tax
      3) the loss of energy-intensive industries post-GFC and the natural pivot to
      service industries
      4) milder winters (although cancelled out by warmer summers the last few
      years?)
      5) better building stock in both commercial and residential
      6) more insulation in existing houses
      7) more efficient appliances and aircon
      8) solar installs starting to impact on demand

      Anything else?

      1. Giles Avatar
        Giles

        That’s a good list BIFF, but judging by the recent comments from the likes of AGL, Energex and other utilities, you probably need to reverse the list to get the order of importance and impact.

        1. Biff Avatar
          Biff

          To paraphrase Mandy Rice-Davies, they would say that, wouldn’t they!

      2. Peter B Avatar
        Peter B

        Biff, while the decline in consumption began in 2008 the actual change in the previous two decades of NEM growth of approximately +1.8% p.a. was in 2006 some two years before the GFC. In finance, it was also the same year that Australians began to change from accumulating debt towards now becoming net savers at about 10% p.a. So you need to add a national psychological shift from consumption to saving to your list. So our supposed “uncaring” and/or “ignorant” citizens, well ahead of the Government and Markets, realised that the “boom” was not going to last forever. It was the change in mindset along with the availability of solar, the drop off in manufacturing, insulation, LEDs and other new appliances that affected the change. What is interesting is that the rate in drop off in consumption has been changing quite consistently so the question is, even with continual population growth; when will the decline flatten and/or eventually level out(?).

  3. Ron Barnes Avatar

    What do they expect they put up energy prices , so people use less.

    1. patb2009 Avatar
      patb2009

      but they did that for 70 years,

      1. Ron Barnes Avatar

        Not as much as now price increases should not be more than the CPI.

  4. paddybts Avatar
    paddybts

    That’s a pretty good list Biff. Any academics/economists out there, who would care to try calculating the various effects?

    1. Chris Fraser Avatar
      Chris Fraser

      We won’t ask for Barnaby Joyce’s view (an he’s an accountant). He says it’s so hot the Carbon Tax definitely isn’t working !

  5. Bob_Wallace Avatar
    Bob_Wallace

    Is it the case that demand is decreasing but at times hourly demand is increasing due to more AC use?

    Perhaps due to end-user solar the old midday peak is dying but a new late afternoon/early evening peak is building?

Get up to 3 quotes from pre-vetted solar (and battery) installers.