Updated: (see below)
The Australian Energy Market Operator has again slashed its demand forecasts for the coming year and over the coming decade, as households and business turn increasingly to rooftop solar PV, and as energy efficiency efforts also take bite.
The latest AEMO National Electricity Forecasting Report – released on Friday – cited rooftop solar and energy efficiency regulations in buildings as the main reasons cutting its forecast demand across the National Electricity Market (which includes all states except WA and Northern Territory) for 2013/14 by 2.4 per cent. Lower than expected industrial demand also played a role.
This comes a year after AEMO slashed its forecasts for 2012/13 by nearly 10 per cent. As it is, demand for 2012/13 looks to have come in 1.1 per cent below event that forecast.
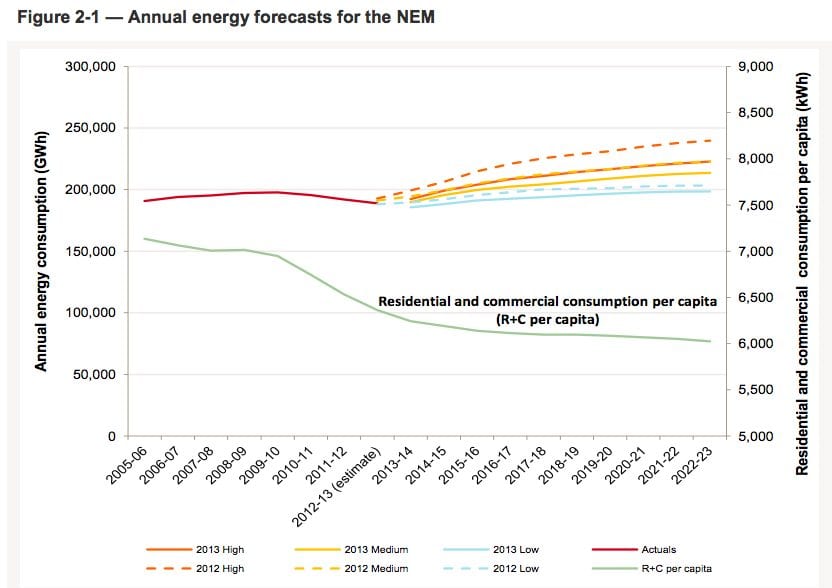
Indeed, as the graph below suggests, the average use per capita has fallen dramatically across the country, from more than 7,000kWh per year to less than 6,000kWh. “Individually, consumers are using less electricity than they used to,” AEMO CEO Matt Zema said.
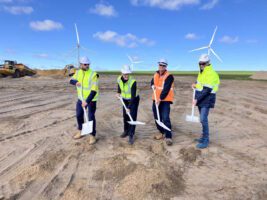
Across the NEM, residential and commercial electricity use is forecast to be 6.3 per cent below the 2012 forecasts due to a 37.7 per cent increase in energy efficiency savings and a 17.9 per cent increase in rooftop PV output. Australia has one of the highest penetrations of rooftop solar in the world, and around 2.5GW has been installed so far.
Crucially, and this will play to some of the political rhetoric around rooftop solar, and the efforts of some state governments (particularly Queensland), to demonise it, AEMO also recognized that solar PV was reducing summer peak demand – and the forecast maximum demand across the NEM for 2013/14 had been cut by 728MW from just last year.
That just happens to coincide with the rate of installation of solar PV in the last 12 months, which is estimated at around 800MW. The 728MW would be the equivalent of a significant coal fired power station, or up to half a dozen smaller gas peaking power plants designed to meet peak demand.
The downgrade on peak demand also suggests that few, if any, network upgrades will be required. Indeed, it also suggests that some of the costly upgrades in the recent past have been superfluous to requirements, supporting arguments that some of those investments should be written down to reduce the burden on consumers.
The other major conclusion for the AEMO report is that the 10-year outlook for electricity demand has been cut dramatically again – by one quarter, from 1.7 per cent annual growth to 1.3 per cent annual growth.
This means that in just the last two years, the medium forecast for total electricity demand in the NEM to 2020 has been slashed from more than 240,000 gigawatt hours to 213,000GWh. Under a low forecast scenario, demand could fall to below 200,000GWh. Even the high scenario – once put at more than 260,000GWh, suggests no more than 220,000GWh.
Queensland, because of the massive LNG plants being built around Gladstone, and because of its higher population grown, is the only state expected to experience strong growth in demand.
This graph below illustrates the revisions between this year and last year. Click here to see the even bigger revisions announced from 2011.

One of the reasons for the revised estimates is that AEMO has introduced new modeling techniques, including those that better recognize the impact of solar and energy efficiency. Up to two years ago, it relied heavily on forecasts given to it by state-owned network operators, who had a self-interest to give bullish demand forecasts because it would justify greater infrastructure investment and bigger profits for the networks.
Consumers are now paying heavily for those forecasts, and for network assets that may not have been required. But those same network operators, along with other incumbent generators and retailers, are now likely to use the pared down forecasts for their own benefit, this time by resuming their campaign to have the renewable energy target diluted, or even removed.
The RET calls for a minimum 20 per cent sourced from renewables by 2020, and at the current rate it could be heading for up to 24-25 per cent, if the WA and NT grids are included. The pleas by incumbents to dilute the RET to protect their profit margins are likely to fall on deaf ears at the Climate Change Authority, which will conclude once again that having a policy over-achieve in the right direction is probably a good thing.
But the Coalition has vowed to disband the CCA and has indicated it will be sympathetic to the pleas of the generators and network operators. It has insisted on another review of the RET in 2014.
Increased use of solar PV, where consumers generate some, or even a large part of their own energy needs, and increased energy efficiency (which also reduces demand), are two of the central planks of policy measures taken by the US and China to reduce their emissions. It is also part of the central policy recommendations of the International Energy Agency.
(Updated estimated renewable percentage from earlier version to take into account the WA SWIS and NT grids).