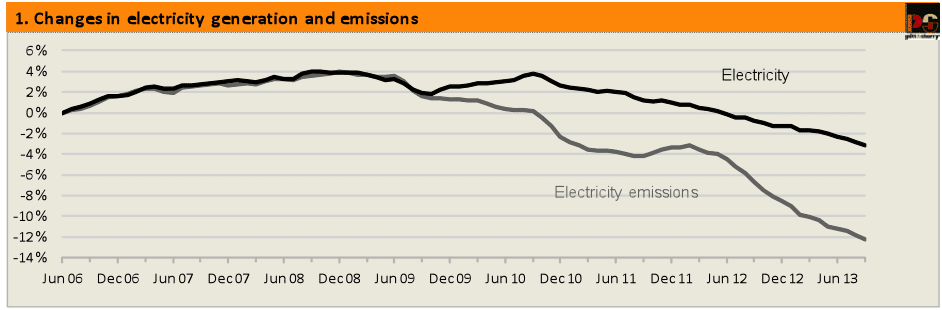
Electricity demand and emissions across Australia’s National Electricity Market continued to fall in the year to September, 2013.
Generation from black coal, brown coal, gas and hydro all fell in absolute terms, though in relative terms (share of a lower level of total demand) hydro increased marginally.
Only wind generation showed significant growth (Figure 2). The coal share of total generation was 74.4%, gas 12.3%, hydro 9.1% and wind 4.2%. Demand was down by nearly 7% from its maximum in the year to December 2008. The displacement of coal by wind, hydro, and gas generation, coming on top of the fall in demand, saw emissions down by 29 Mt CO2-e, equal to nearly 16%, over the same period.


As is well known, South Australia has a larger installed capacity of wind generation than any other state and, given its relatively small total demand, by far the largest share of wind in total electricity supply. It also has a much larger share of electricity supplied by rooftop PV than any other state, though less in absolute terms than each of Queensland and NSW. Figure 4 shows the changing shares of the major sources of electricity supplied through the transmission network in SA over the past six years.
The trend shows clearly that the steady growth in wind generation has gradually displaced coal fired generation throughout the period. The very old and inefficient Playford B power station was off-line for much of 2011 and has not generated at all since February 2012. The more modern Northern power station (commissioned 1985) is moving towards operating only in the summer half of the year. This year Unit 2 was shut down from early April to late September, while Unit 1 operated at an average capacity of less than 70% during June and July, but is now shut down.
Over the past year or so increased net imports from Victoria have also been displacing both coal and gas in SA. The day by day data suggest that the carbon price contributed to the displacement of local coal fired generation by coal fired electricity imported from Victoria, with the lower fuel costs of Victorian generators presumably off-setting the lower emissions but higher fuel costs of both Northern power station (coal) and some of the gas fired power stations.
On 4 September last, the Australian Energy Regulator (AER) approved an investment to upgrade the capacity of the Heywood interconnector, the major transmission link between Victoria and SA. When completed, this upgrade might be expected to facilitate further increases in net imports to SA of Victorian electricity during periods of low wind generation but also, as the AER noted, allow larger exports of wind generated electricity from SA to the east during high wind periods.

The shares of transmission level electricity supply in SA in the year to September 2013 (the end of each line in Figure 4): were:
Coal 16%
Gas 45%
Wind 27%
and net interconnector imports 12%.
These figures do not include the contribution of rooftop PV, which is connected at the distribution level of the electricity supply system, not the transmission level, at which the NEM operates. Data recently published by AEMO suggest that rooftop PV contributed 4% of total electricity in SA in the year to September 2013. Month by month data are not available, and so PV cannot be readily incorporated into Figure 4. However, including PV in the year to September 2013 totals changes the shares to the following values:
Coal 15%
Gas 43%
Wind 26%
Interconnector 12%
and PV 4%.
Total renewables are thus 30%.
On 23 September AEMO released a report entitled Integrating Renewable Energy – Wind Integration Studies Report. It projected that wind generation capacity in SA could more than double by 2020, from the current level of 1,205 MW to 2,555 MW.
The report concluded that this level of wind generation would present “operational challenges” to the maintenance of reliable electricity supply in SA under all circumstances and at all times. Its preliminary conclusion was that, if nothing is done to current operations and network infrastructure in the NEM, significant curtailment (forced shut down) of wind generation may be required in high wind, low demand times in SA (and also in Victoria on the basis of projected wind generation growth there).
The report went on to identify a number of options which might be used to assist smooth integration of greatly increased wind generation capacity into the NEM. Some of the options are for investments in specific types of network equipment, while others involve changes to NEM operational schemes and procedures. The report states that AEMO will investigate the likely costs and benefits of the various options, and advised that further information will be provided by the end of 2013.
Hugh Saddler is principal consultant, energy strategies at Pitt&Sherry