The Queensland Government has made good on its commitment to obliterate virtually the entirety of the state’s climate change and clean energy initiatives, the measures Premier Campbell Newman has deemed to be made “redundant” by the Federal Government’s carbon price.
The state budget that was released on Wednesday reads like a scoreboard of victims, although Newman’s team has only been able to identify savings of $431.2 million over four years – below the previous estimates of $660 million – because, it turned out, that it was contractually obliged to continue with some initiatives.
The highest profile victim of these cutbacks was the Solar Flagships project. Newman wanted to withdraw the $75 million contribution immediately, but had to wait until the Solar Dawn project failed to gain financing by the specified date before it could act. The decision effectively brought the project to a close, although it was struggling anyway.
The roll-call of victims also includes the Queensland Climate Change Fund, the Queensland Renewable Energy Fund, the Queensland Smart Energy Savings Fund, the Solar Initiatives Package, the Waste Avoidance and Resources Efficiency Fund, the Local Government Sustainable Future Fund and the Climate Smart Home Service.
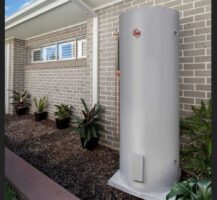
Other projects to be brought to an end are the Solar Hot Water Rebate Scheme, the Solar Atlas, the Cloncurry Solar Thermal Trial Site Remediation and a separate Solar PV Farm, the Bright Thing Campaign, the Renewable Energy Industry Development Plan, and Climate Smart Business Service. The Wide Bay Community Solar Farm has been deferred.
Also gone are the Sustainable Energy Innovation Fund, which leveraged $93 of private funds for every $10 of government money, higher than the anticipated ratio of 8:1, and the EcoBiz program, which delivered average percentage savings in greenhouse gas emissions of 18 per cent in 2011/12, according to the budget papers.
The Geothermal Centre of Excellence and the Wide Bay Pilot Community Solar Farm are the only initiatives that appear to have survived the cuts in the Department of Energy and Water Supply. The entire climate change department was wiped out – with bits going to Science and Innovation and some left in Environment and Heritage.
The budget papers also reveal that the government’s expense through the Community Service Obligation to customers of Ergon Energy in regional and remote areas will balloon to $667 million in 2012/13, a near 10-fold rise, presumably as the rising cost of networks push the cost of delivery well beyond the retail prices in the state’s south-east corner, where the benchmark for the CSO is set.
RenewEconomy raised the issue of the CSO in an article a few weeks ago, pointing out the massive diesel bill (up to $4.8 billion) the government was facing in coming decades, just from servicing small isolated communities in the far west and north and islands, let alone regional centres.
It is generally recognised that the best way to reduce these costs is to reduce reliance on an over-stretched grid, and introduce more renewables (already competitive in remote and off-grid sites), and distributed generation and storage options which can reinforce weak grids and prove cost effective.
But the state government is also winding down its demand management scheme. The papers show that in 2011/12, it delivered reductions in peak demand capacity of 87.8MW, well above the 55MW targeted, from a series of energy efficiency and demand management initiatives.
But the 2012/13 budget only envisages an extra 4.2MW to reach a “cumulative total” of 92MW. The reason for the over-performance? Because of a “number of outcomes being achieved ahead of schedule, changes to the MW calculations and as a result of information now to hand which was previously unknown.“
Garnaut’s coal thoughts
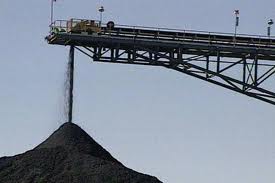
Of course, none of these measures got anywhere near the coverage or the indignity expressed in the mainstream media about Newman’s decision to impose a higher royalty on coal mine exports, a measure which might bring in an extra $1.6 billion over four years.
Is Newman simply playing a game with Canberra and calling its bluff over the share of profits from the MRRT, or does he realise that this might be the last chance to extract money from the tail end of the coal boom?
As RenewEconomy has written on several occasions, most recently here, Australian thermal coal miners have simply refused to believe that demand for their produce could ever fall – hence their determination to dig up virtually the entire Galilee Basin and turn the Great Barrier Reef into a giant coal port and freighter super-highway.
But that fantasy should have been dismissed when the Bureau of Energy Economics produced its recent report that suggested solar PV would be as cheap as, or cheaper than, new coal-fired power generation in Australia by the end of the decade. That’s in a country which can access plenty of coal at its doorstep.
Once that coal is sold at export prices, shipped 10,000km and then still needs to negotiate an ancient railway network, the costs become even less attractive. Little wonder that India predicts the cost of large-scale solar will be cheaper than new-build coal by 2017, and China reckons it will happen in its country by 2020 – hence its recent upgrade of its solar deployment and its focus on larger-scale solar farms.
And as the government’s former chief climate advisor Ross Garnaut said on Wednesday, coal companies have effectively been “dudding” their shareholders, by over-investing in mining projects on the mistaken belief that China would not act to diversify its energy sources and reduce its carbon emissions.
“The fact that large elements of Australian business believe that China was never going to get off its high emissions strategy means there has been a chronic over-investment on a false belief in industries that depended on continued emissions intensive growth in China,” Professor Garnaut said in an interview with The Australian Financial Review.
Now, it seems, some of that planned over-investment is going to come up for careful review. At least the miners can read a commodity price graph.


