Australia’s large-scale renewable energy sector has hit the ground running, or generating, in 2025 with all Australian utility PV and wind assets generating 4,805 GWh in the first month of the year, up 12% from 4,304 GWh in January 2024.
According to the latest data from Rystad Energy’s David Dixon, the nation’s growing fleet of wind and solar helped renewable energy generation reach 44% on the main grid, in January, the first time above 40% for that month.
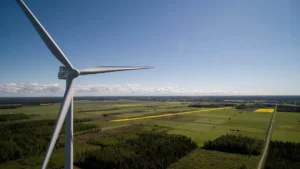
The top performing wind assets for January were mostly located in Western Australia, including the Warradarge wind farm with a capacity factor (CF) of 47 per cent, Yandin (46.3% CF) and Badgingarra (45.9% CF).

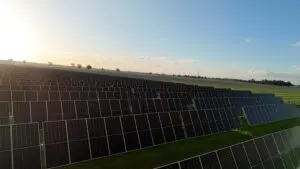
For big solar, New South Wales again dominated the rankings, with the top assets for January including the Griffith solar farm (40.8% AC CF) and Wellington North (40.2% AC CF), and in WA the Merredin solar farm (39.8% AC CF).
New South Wales was also in top spot for overall generation, at 1,615 GWh for the month, with 929 GWh from utility PV and 686 GWh from wind.
Dixon notes that all this renewable energy also translated into a total of 796 hours of negative prices across NEM / WEM states for the month, with most of the accounted for by South Australia, with 250 hours of negative prices or ~34% of January.