As Australia’s federal Coalition and the Murdoch media intensify their calls for nuclear to replace the country’s ageing coal fired generators, thereby ensuring that the switch to renewables is halted and climate action delayed, it is worth reminding ourselves exactly how quickly wind and solar can do the job.
As RenewEconomy has noted, South Australia has shone the light for the rest of the country on the path to renewables, achieving an average 82 per cent share for wind and solar over the entire December quarter.
That’s a world record share for a grid of this size, and an achievement that proves the technology doubters wrong. If it can be done at gigawatt scale, it can be done elsewhere.
Australia has a national target of 82 per cent renewables (including hydro) by 2030, set by the federal Labor government, and backed by strong state targets.
Whether that target will be met in time will depend on a number of factors, including social licence, transmission, grid connections, supply chains and a bunch of regulatory and market factors. But South Australia has already responded to the “can it be done” question.
Nat Bullard is one of the world’s leading clean energy analysts, having spent more than two decades at BNEF before going it alone late last year, and he recently released his annual presentation on the state of decarbonisation around the world.
It is a fascinating and worthwhile read. And I’ve highlighted just five of his 200 graphs that caught my eye because of what they tell about the story of wind and solar and the pace – real and potential – of the green energy revolution, and why conservatives and their fossil fuel pay masters are so upset about it.
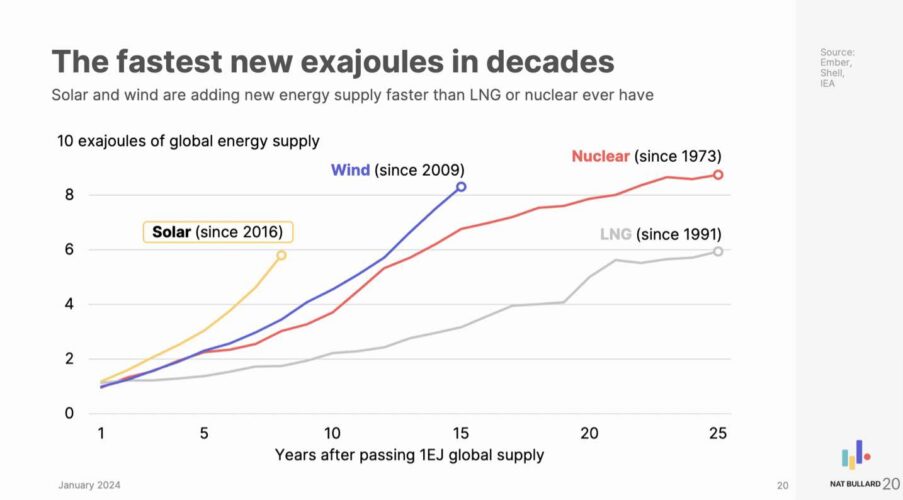
The first graph illustrates one fundamental point – that wind and solar are adding new energy capacity faster than LNG or nuclear ever have, and that’s even counting the nation-building and defence-industry led nuclear build-outs led by the likes of France in the 1970s and 1980s.
It has been quick, and it is getting quicker, with China leading the way, and as solar module prices, in particular, fall to record lows.

As this next graph above shows, solar installations have grown one thousand fold in two decades, and in 2023 the world installed some 440 GW of new solar PV capacity – more than the entire existing capacity of the global nuclear fleet.
And it shows no signs of slowing down.
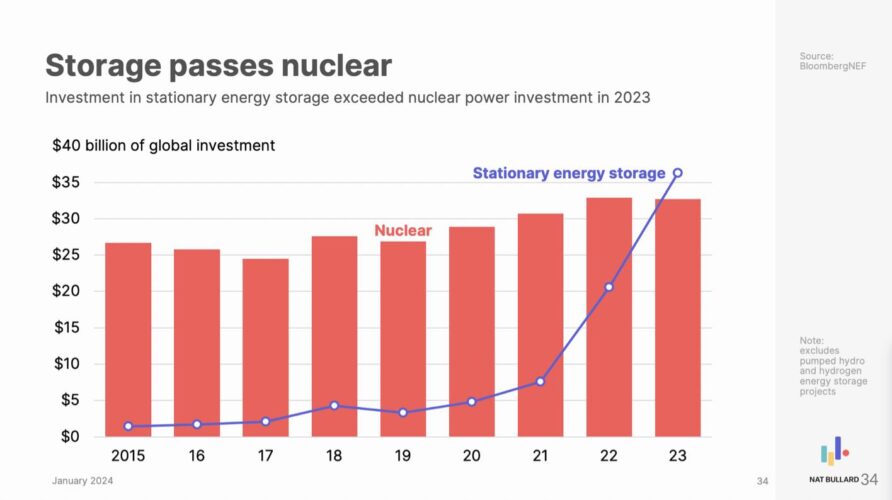
Even storage has outstripped nuclear in investment terms, and is also rising quickly.
But here is the next issue, and it is particularly relevant to the current political and media debate in Australia, and the attacks from the Coalition and much of mainstream media about new technologies – wind, solar, battery storage and electric vehicles.

As Bullard points out, the attacks have morphed in recent years from targeting the science of climate itself to the solutions to the problem. This is not new. In Australia we have long had conservative politicians attacking wind turbines, mocking batteries, and warning that EVs will “ruin the weekend.”
But as Bullard’s graph points out – using data on YouTube videos – the focus has now very much switched to the attacks on the new technologies. Some of them are barking mad and so absurd you wonder how anyone can believe them – but they do, and some of these videos get millions of views.
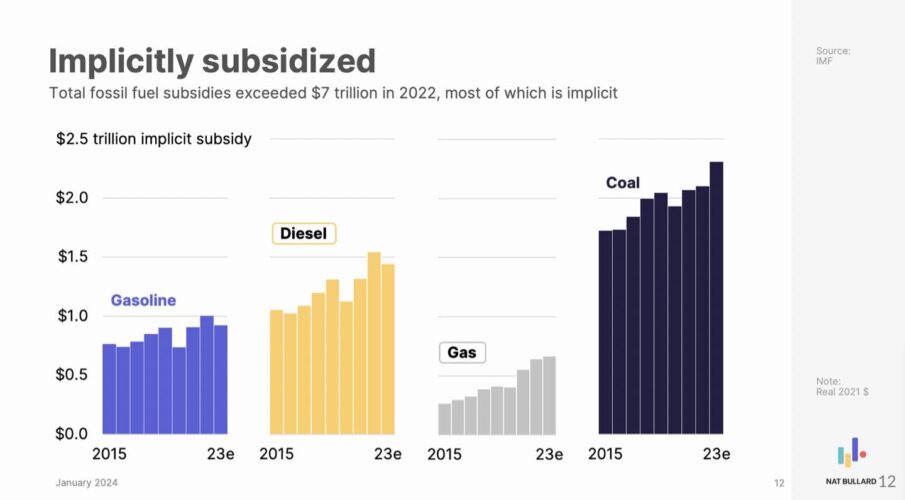
There is a reason for this. The fossil fuel industry learned from the price inflation amplified by Russia’s invasion of Ukraine that they have trillions of dollars or revenue and tens of billions of profits to lose from the transition.
Some of that revenue comes to them in the form of implicit subsidies that have been in place for years (see graph above).
So it is no surprise that they have pushed tens of millions to support and amplify the attacks on renewables, EVs and other technologies, not just through YouTube videos and Instagram and other social media, but also through multiple so-called “think tanks”, whose only apparent purpose is to disinform.
So near to a solution, yet in many ways still so far.


