The politics may not change much, but Australia’s electricity grid is changing before our very eyes – slowly and inevitably becoming more renewable, more decentralised, and challenging the pre-conceptions of many in the industry.
The latest National Emissions Audit from The Australia Institute, which includes an update on key electricity trends in the National Electricity Market, notes some interesting developments over the last three months.
+ Renewables-rich South Australia became a net electricity exporter for first time;
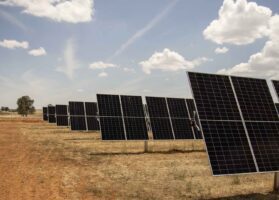
+ 12 new wind and solar farms totalling 1050MW of capacity were added to the grid, including 500MW of large-scale solar, trebling the amount of large-scale solar in the system;
+ The continued rapid uptake of rooftop PV by homes and businesses kept a lid on grid demand, even if overall consumption showed a rise, and;
+ Electricity generation emissions in the NEM fell again, but only slightly.
The most surprising of those developments may be the South Australia achievement, which shows that since the closure of the Hazelwood brown coal generator in March 2017, South Australia has become a net exporter of electricity, in net annualised terms.
Lead author Hugh Saddler notes that this is a big change for South Australia, which in 1999 and 2000, when it had only gas and local coal, used to import 30 per cent of its electricity demand.
The fact that wholesale prices in South Australia were higher in other states – then, as they are now – has nothing to with wind and solar, but the fact that it has no low-cost conventional source and a peaky demand profile (then and now).
“The difference today is that the state is now taking advantage of its abundant resources of wind and solar radiation, and the new technologies which have made them the lowest cost sources of new generation, to supply much of its electricity requirements,” Saddler writes.
He notes that way back in the 1950s, when the local supply problem was first recognised, the then Electricity Trust of South Australia undertook a study into the feasibility of wind generation, about half a century before it was actually built.
Other things to note about the flows between states is that Victoria was about equal on imports and exports with its three neighbouring states, despite the closure of Hazelwood, while NSW continues to import around 10 per cent of its needs from Queensland.
This has nothing to do with the lack of supply in NSW. Its coal generators continued to deliver only around two-thirds of the time, it’s just that NSW plants are older and more expensive than the ones in Queensland.
Another interesting point is that gas-fired generation has increased in the last year or two in South Australia as a result of the Northern closure, but is still below the levels of a decade ago.
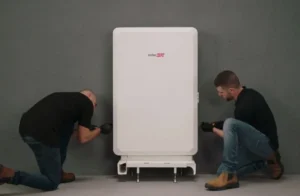
But because it is expensive, this is likely to spur more investment in storage.
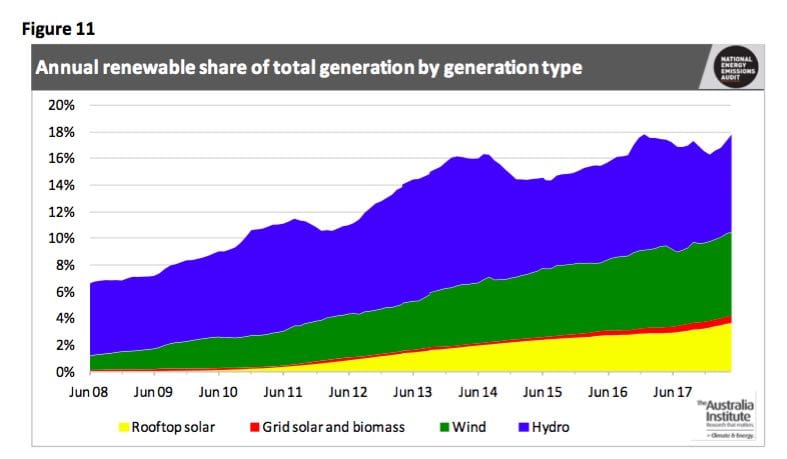
As for rooftop solar, Saddler notes that the share of residential solar in the grid is still relatively small but it is the most steadily growing generation source in the NEM. (See red line in chart below).
That line is expected to grow steadily. By 2040, or perhaps 2050, the share of distributed generation, which includes rooftop solar, battery storage and demand management, is expected to reach nearly half of all Australia’s grid demand.
Saddler, says, however, that the increase in large-scale solar over the last few months is a significant milestone in Australia’s transition towards clean electricity generation. (See very top graph).
“Firstly, they are a concrete demonstration that the construction cost advantage, which wind enjoyed over solar until a year or two ago, is gone.
“From now on we can expect new capacity to be a mix of both technologies. Indeed, the Clean Energy Regulator states that it expects solar to account for half of all (new renewable) capacity by 2020.”
As for the change in emissions, this graph above tells the story, the brown line is key – there was another slight fall in the latest period.
But Australia – thanks to the closure of coal-fired generators and their replacement with wind and solar – has cut emissions by 18 per cent from the electricity grid in a decade.
Sadly, the government target is just a 26 per cent reduction from 2005 levels by 2030. Most of the rest of the target will be met over the next two years when the build-out of more wind and solar to meet the renewable energy target is completed.
Then what?

