Switch to solar gathers speed as two new solar farms join grid

Parkes solar farm
Parkes solar farm rated the best in terms of revenue per MW installed.

Parkes solar farm rated the best in terms of revenue per MW installed.

Australia’s ineluctable switch to solar power is gathering speed, with another two large scale solar farms switched on in New South Wales in the last few weeks, and another dozen due to connect in NSW and Queensland in coming months.

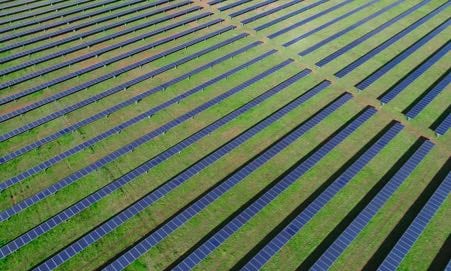
The 55MW Parkes solar farm and the 30MW Griffith solar farm started production at full capacity in the last couple of weeks, with the 25MW Dubbo solar farm also connected and expected to begin generation soon.

All three projects are owned by French renewable energy developer Neoen, the owners of the Tesla big battery (also known as the Hornsdale Power Reserve), and 309MW Hornsdale wind farm, and the Bulgana renewables hub that has begun construction in Victoria.

The addition of the Parkes and Griffith solar farms extends – at least for the time being – the NSW state’s leadership in large scale solar. (Graphs courtesy of Climate Energy College).

But that status will soon be challenged by Queensland, which has nearly 2GW of large-scale solar under construction or committed, and also by South Australia and Victoria, both of which have several large-scale projects under construction.

Indeed, Australia will have more than 2GW of large-scale solar in production by the coming summer, a shift that is likely to change the shape of the wholesale pricing curve, sometimes pushing minimum pricing from night-time to the mid-day hours.

Bloomberg New Energy Finance estimates that Australia will have nearly 4GW of large-scale solar capacity by 2020, although it expects the country will add little more under current and proposed policy settings and emissions reduction targets.

However, if a reduction target of 45 per cent was set by 2030 – as recommended by the Climate Change Authority, and the bare minimum targeted by Labor – then large-scale solar could top 11GW by 2030, adding to the 19GW of rooftop solar expected by then (7GW now).

“The continued influx of rooftop PV and addition of gigawatts of large-scale PV from the RET is going to put substantial downward pressure on midday wholesale electricity prices,” says Kobad Bhavnagri, the head analyst of BNEF in Australia.

“In the next decade the solar noon will become the cheapest part of the price curve.”

Given a policy environment that matches the Paris climate commitments, BNEF expects that by 2040, the combination of large-scale and rooftop solar will account for more than half of Australia’s installed capacity.

NSW already boasts the 102MW Nyngan and 53MW Broken Hill solar farms, and 57MW Moree solar farm, along with the newly completed Gullen Range solar farm and a collection of smaller installations around the ACT, including Royalla, Mugga Lane, and Williamsdale.

But the status of NSW as the leading solar producer will soon be challenged as a stream of new projects connects to the grid in Queensland, including the 116MW solar farm being built for zinc refiner Sun Metals and the 116MW Ross River solar farm.

Already completed in Queensland are the 50MW Kidston solar farm, the 20MW Barcaldine solar farm, the 11W Dunblane solar farm, the 10MW Lakeland solar and storage facility and the 15MW Valdora solar farm.

Other projects soon to be completed include the 112MW Darling Downs solar farm, the 15MW Longreach solar farm, the Whitsunday and Hamilton solar farms (both 57.5MW), and the Collinsville solar farm 41MW – all under the ARENA large scale solar program.

All told, there is more than 1,800MW of large scale solar under construction in Queensland, which will add to the 2GW of rooftop solar installed across the state by homes and businesses.

Other solar farms under construction in NSW include the 20MW White Rock solar farm and the 41MW Manildra solar farm, although there are many large projects about to begin construction or waiting for financial settlement.

Update: The size of the Ross River solar farm has been updated to 116MW, not 142MW as initially reported.

Note: The Australian large scale solar market is experiencing unprecedented growth. But it won’t stop now. Large Scale Lookout – compiled by SunWiz and RenewEconomy – provides an insider view of Australia’s large-scale solar market.

To enquire about ordering your copy of Large Scale Lookout, email [email protected]

Comments

25 responses to “Switch to solar gathers speed as two new solar farms join grid”

  1. john Avatar
    john

    The story about PV is just going to become more and more for the simple reason cheaper than any other kind of energy production where there is no wind.
    Once the grid is saturated with solar then it is time to store excess production and when done with PHES all over the grid there is going to be need to put more wind in to help the whole system move to these energy production systems that produce energy at the cheapest cost possible.

    1. Ian Avatar
      Ian

      No need to wait for the development of wind farms, these should be encouraged to the same extent as solar. Demand management , such as hot water heating will become more and more important as utility scale solar bites deep into the daytime electricity demand -duck curving.

  2. George Darroch Avatar
    George Darroch

    Looking forward to seeing more of the bright orange wedge on the sidebar widget!

  3. Phillip Wild Avatar
    Phillip Wild

    Seems that commissioning might have also commenced at Clare Solar Farm in North QLD. From AEMO SCADA data, over the last two days, it has been contributing around 15 to 17 MW.

  4. stucrmnx120fshwf Avatar
    stucrmnx120fshwf

    Based on historical growth, 50% of power by 2040, is laughably unambitious, in 2028, solar power will be 1/4 of the price of carbon emissions based power, in a normal world, where power is a quarter the price. The past total times the inverse square of the price reduction, occurs, so if the price is 4 times lower, the consumption, is 16 times greater, than the total previous consumption or 1,600%.

    Look at how the other photovoltaic technology, LED’s have almost completely replaced cathode ray tubes, as screens and expanded the number of pixels available, by well over an order of magnitude. It’s as if we’ve learned nothing from the Asian economic miracle, or the peak decade of the second industrial revolution, resulting in the roaring twenties.

    Then there’s Australia, 75% desert, the size of a continent, if the world is using 25 times as much energy in 2030, then 25% of Australia’s desert, could supply 1,250 times Australia’s current usage. That is exports, of electrons, via cable, as well as billions of tonnes, of liquid hydrogen.

    1. Greg Hudson Avatar
      Greg Hudson

      ”Then there’s Australia, 75% desert, the size of a continent”
      Geography lesson 101… Australia IS a continent, not the ‘size’ of one.

      1. stucrmnx120fshwf Avatar
        stucrmnx120fshwf

        I don’t remember saying Australia wasn’t a continent, I give you something to talk about and all you can talk about, is some kind of semantics.

        Doesn’t potential seismic shifts in history, economics, engineering interest you at all. Have none of you read Tony Seba’s Clean Disruption, are you certain China going to high speed rail in little more than a decade. The US economy changing, it’s transportation energy, to unconventional hydrocarbons, isn’t a signal that things can change, on a big scale, fast.

        Nothing about the substance of what I said, electric vehicles, high rise farming, nothing of intellectual content at all ? !!

  5. RobertO Avatar
    RobertO

    Hi All, If households and small business continue to grow (1.3 GW this year growing to at around 2 GW pa in 2020) and both commercial wind and solar with storage continuing to grow we will see some 12 to 15 GW in 2022. We could lose some 50% of our coal power by 2022. As we grow in the numbers the failure of a large coaler becomes less of an issue due to storage with rapid responses. If only the Fed Gov would get behind RE instead they try to stand in front to stop this change over.

  6. Francis Young Avatar
    Francis Young

    These charts show why the rated generation capacity of solar is being downgraded by AEMO. In the sequence of sunny days on these charts, the total yellow area represents the realisable capacity; the total white area represents the unachievable capacity.

    Note also that the 55MW Parkes farm is shown on a scale capped at 50 MW, and the 30 MW Griffith farm is on a chart cropped at 25 MW.

    So, we see that a brand new solar farm, in optimal weather, is yielding about 15% of stated capacity (the yellow area compared to the white area up to the rated scale). This needs to be considered when comparing the cost of generating options.

    1. Giles Avatar

      These solar farms will operate at about a capacity factor of 30 per cent, not 15 per cent. The output will be significantly higher in summer, both in maximum and average output, so your claim that the “total white area represents the unachievable capacity” is complete claptrap.

      1. Francis Young Avatar
        Francis Young

        Your chart shows actual data, not speculation. If you extend the Parkes scale to 55MW, the white area represents the non-generated nameplate capacity. No claptrap is required.

        We are now around the equinox, so the generation on this chart represents the average for all seasons, subject to days when cloud cover will reduce output.

        1. Giles Avatar

          Oh please. if you show charts of any generator from yesterday or last week – coal, gas or otherwise – nearly all would be well short of rated capacity. What you said was that the additional output was “unattainable”. that’s the claptrap.

          1. Francis Young Avatar
            Francis Young

            Giles, consider the best-performing days, 28, 29, and 30 April 2018 on the 50MW chart for Parkes. Now add the missing 9% to extend the scale to 55 MW (because the three-day rectangle only shows 91% when capped at 50 MW), and you can calculate how much of the rectangle is yellow. The white area is unattainable capacity on a good day at the equinox. It’s pretty simple. If Alinta spends some dosh remediating leaky boilers at Liddell, what is the unattainable capacity of its 2051 nameplate rating? After ten years, how much will the solar farm output drop? After 50 years? I am not looking to gild the lily, but simply to get a handle on real-world value for taxpayer subsidy and investor funds when deciding what to build or remediate to deliver reliable, cheap, electricity.

          2. Mike Westerman Avatar
            Mike Westerman

            Nameplate rating is not a mythical number – it is a capacity attainable under prescribed conditions ie it is factual, based on real world engineering. There are many reasons why engineers may not anticipate, in deriving revenue and cost estimates, operating the plant at or even anywhere near nameplate. Nameplate rating will drive capital costs, but is only one of the factors that drive operations. Hence the use of plant factor and capacity factor to relate energy delivered to nameplate (and the analogous revenue to capex).

          3. Francis Young Avatar
            Francis Young

            You are quite correct, Mike. If an investor is looking to spend $300 million on a generating asset, nameplate rating matters, and so do any factors that will reduce the electricity generated and saleable.

            This concept applies regardless of the technology, and the revenue-affecting factors vary across real world scenarios. With solar, the factors include sunlight availability, storage to timeshift to demand, distance from load, efficiency of the panels, and subsidies offered. My point is merely that subsidy and investment can usefully observe total power generated from these charts, and cannot expect power in the white areas of the chart.

          4. Giles Avatar

            I think investors in wind and solar plants are well aware of the output from solar farms, which is why they make key decisions on tracking systems, orientation etc.
            Some of them have even discovered that the sun sets at the end of the day.

          5. Giles Avatar

            The Liddell rating of 2051, if that’s what you are suggesting it is (i thought it was 2000) has been unattainable for the best part of two decades. I believe it is now down to 1800, and AGL have often referred to it as 1680. In any case, it barely operates above 50% capacity factor.

          6. Francis Young Avatar
            Francis Young

            Yep, and the leaky boiler remediation cost is likely to be substantial, perhaps as much as a solar farm of 100 MW might cost. But if that new 100 MW solar farm only manages 20 MW per day, and the same investment in Liddell generates 150 or 200 MW extra per day, without requiring new land acquisition and grid construction, it gives investors a clearer picture of how to proceed.

          7. Giles Avatar

            “But if that new 100 MW solar farm only manages 20 MW per day.”
            What on earth does that mean. You measure capacity in MW, but production must be MWh (megawatt hours).
            And a 100MW solar farm is perfectly capable of producing more than 500MWh a day on average. My 5kW system does 20kWh a day averaged over the year and the solar farm will do a lot better than that.

          8. Francis Young Avatar
            Francis Young

            Apologies for my slip. I meant to suggest that, as you say, on average over 24 hours, a new solar farm rated at 100 MW might produce 20 MWh of dispatchable energy per hour, or a total of 480 MWh. It would of course be generated during daylight hours, but the total would come to 480 MWh. The Parkes and Griffith charts suggest this is optimistic. The same investment in remediation of Liddell might raise its capacity from 1680 to 1880, or 200 MW. But this extra capacity is available 24 hours a day. Even if only 50% of the extra were generated, that is 2,400 MWh in a 24 hour period, compared to 480 MWh from the solar farm. My apologies for not stating this more clearly above.

          9. Giles Avatar

            What’s the point of saying that a solar plant produces an average of 20MWh an hour over 24 hours when everyone knows the sun doesn’t shine at night time. so the key point is how much it produces during the day.
            And Liddell is a fat lot of good when it is not producing at peak times because of a technical issue, as the NSW energy minister has highlighted for the last two peak periods over the last two summers. His message was that solar saved the bacon for the grid.
            And Liddell’s output probably useless at night time as well, when it probably not meeting any demand.
            You really have to move on from concept about “baseload” to something more modern. Start with base-cost renewables – we’ve written about it here. Find the cheapest generation, work out when they will produce and how much, and then figure out cheapest way of filling gaps. Will work out cheaper than turning to gas generation as coal has for the past half century.

          10. Francis Young Avatar
            Francis Young

            The point is the cost. Demand will rise with population, so the current maximum demand of over 30 GW during heatwaves and cold snaps will increase to the high 30s. Load shedding has a dramatic cost, especially for smelters, and I note that AGL is proposing a 252 MW gas plant next to the Tomago smelter for this reason, after the near catastrophic load shedding in 2017. It is not sufficient to replace lost coal generation with the same amount of solar or wind. You need to add significantly more, along with battery or pumped hydro storage to timeshift it. It matters whether the cost to meet this demand is a few billion or tens of billions. That is the point.

          11. Giles Avatar

            You are right about the cost. With solar going full bore at that load-shed, the price was at its maximum and the grid nearly collapsed. Why?. Because 1,000MW of Liddell had failed and the two biggest gas generators – Tallawarra and Colongra – also failed at the same time.
            AGL has indeed proposed a 252MW gas plant. remains to be seen if they actually build it, but its a technology that is only designed to be switched on occasionally. will likely operate at around 2% capacity, possibly less, typical of the peaking plants installed to back up coal when it melts in the heat.

          12. Giles Avatar

            Oh, and i don’t think that max demand will rise to the high 30s. can’t see that predicted anywhere. peak demand has actually been falling, and is well below what was predicted – which makes a lot of people wonder why they over-invested in networks and peaking plant

          13. Mike Westerman Avatar
            Mike Westerman

            Cost and risk are both part of the equation. Cost needs to include both capital cost and operating cost, which for solar is virtually nil, while for coal substantial. The present and future risk for coal investments is so high no-one in Australia is making it, and there is a sharp decline elsewhere.

            Both operate supposedly in a merit order dispatched market, despite the desire of the government to infer directly rather than get the policy settings right and let the market get on with its function. There is no obligation for any generator to operate 7×24, and the value of supply at any timeslot should be the result of the demand at the time. If a load needs 7×24 supply it should pay for it. And if there is a long term need to plan adequate supply (because it is acknowledge that it is mathematically impossible for 30min bids to determine 25y forecasts – they get lost in the noise), then clear government policy should provide the right incentives, and particularly should ensure value capture by those taking the most cost effective risk. The lack thereof has landed us in the current mess.

Get up to 3 quotes from pre-vetted solar (and battery) installers.