The eyes of the energy world are upon it, but the renewable energy transition in South Australia is probably one of the misunderstood, misreported and under-appreciated achievements of our time.
South Australia, for those who have not been paying attention, has dumped coal and now sources more than half its generation from wind and solar, becoming a net exporter rather than an importer of electricity along the way.
It now has plans to make that share of renewables “net 100 per cent” in a decade, and a multiple of that in the future. Given its location, at the end of a long and skinny grid with little connection to other markets, it is truly remarkable – and an inspiration to institutions, policy makers, consumers and the industry itself about what is possible.
What is also remarkable – at least in the context of Australia’s political environment – is that this is a bipartisan effort. The team that led the transition plan for Jay Weatherill’s Labor government has largely been kept intact by Steve Marshall’s Liberal government that took power early last year.
Sure, Labor and the Liberals have bickered and continue to do so over various aspects of policy design (notably the use of “targets” and the role of a new inter-connector), but the current state Liberal government is clearly as keen on this transition as its Labor predecessors.
The reasons are obvious: Cheaper green power and an opportunity to rebuild the state’s manufacturing industry and bring in new business.
Last week, Richard Day, the director Low Carbon Industry Development in the Clean Energy Transition Division of the SA Department for Energy and Mining (whose lengthy title probably includes at least four words that would be banned in its federal equivalent) gave a fascinating and detailed look into how the transition has occurred, and what is next.
We’ve decided to pluck out what we consider to be the best graphs and tables from his presentation.
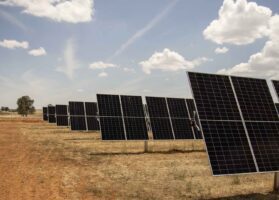
In that 15 year period, the state has shifted from zero large-scale wind, solar and storage, to 2,675MW (and there is a lot more coming, see below). The first wind installation was at Starfish Hill in 2004, the latest is the Lincoln Gap wind farm and battery and the Willogeleche wind farm.
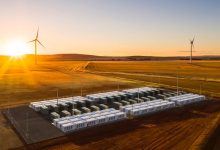
In 2017, the first big battery was installed at Hornsdale, followed by another battery the next year and the first large-scale wind farm. And there is a growing list of huge projects that combine wind, solar and various forms of storage – battery, pumped hydro and hydrogen – in the pipeline.
There has, of course, also been rooftop solar, which has also grown from a negligible amount to more than 1.2GW over the same period.
The uptake was initially driven by households, but is now increasingly driven by small and large businesses, anxious to use rooftop solar to cut their power bills.
That uptake is accelerating, as this next graph illustrates. There were spikes in uptake in 2011 through to 2013 due to the generous feed-in tariffs on offer at the time, but the rate of adoption is jumping again thanks to the economics, and particularly for the business sector which accounts for nearly half of the uptake over the last year.
This is probably the principal causes for concern for the market operator, because while the output of large-scale wind and solar and storage is visible, and controllable, the output of rooftop solar is neither seen, nor on tap.
The authorities are looking for ways to change this, which will likely emerge through the adoption of new inverter standards, the encouragement of “connected” inverters and batteries, and of “virtual power plants”.
These will link installations in homes and businesses to provide a “dispatchable” resource that can be used by third-party aggregators and called upon by the market operator.
To put all of this in some context, South Australia now ranks number two in the world – behind Denmark – in total share of electricity generated from”variable” sources – i.e. wind and solar. (This graph says 48 per cent, but the figure is now clearly above 50 per cent, and a higher percentage of local demand).
What makes South Australia’s achievement all the more remarkable is that South Australia is located at the end of a “skinny” grid, has a “peaky” load that averages around 1,500MW, but can go to more than 3,000MW in the summer heat, and to as low as 500MW in mild and sunny spring days, and it has little connection to other markets, unlike Denmark and most other regions.
And, as Day points out, the state has aged infrastructure assets built in the 1950s, and 1960s.
But there is more to come. This graph above shows what’s been built and just about completed (smaller pie to the left), and what’s in the pipeline (bigger pie to the right). Note the switch in interest to large-scale solar and to various forms of storage in the pipeline pie.
According to state government figures, that amounts to $21.5 billion of projects in the pipeline. Some private analysts in South Australia put the pipeline at more than $25 billion.
Just a fraction of this pipeline would take South Australia close to its “net 100 per cent” target by 2030.
But the state wants to go further than that, courtesy of its excellent wind and solar resources, illustrated in this map above.
The Liberal government has outlined its vision to tap into cheap wind and solar and the possibilities of “green hydrogen”, and exporting cheap power in the form of electricity over transmission links, via transportable fuels such as hydrogen or ammonia destined to markets in Asia or Europe, or as “green metals” – value added and refined products driven by the availability of cheap and clean power.
The state is also looking to clean energy and renewable hydrogen opportunities in minerals processing, agriculture, mining, and using old mine sites to provide various forms of storage, such as pumped hydro or compressed air.
And, of course, it is looking at transport – hydrogen and electric for mining and heavy transport, as well as electric vehicles.
South Australia has historically had the highest prices of energy of any Australian state, thanks to its location and dependence on expensive gas. But in the month of October, it had the lowest wholesale prices in the grid. One swallow does not make a summer, but it is a sign of the transition taking place.
Its shift to renewables has been justified by the big plunge in both solar (down 85 per cent in ten years), and wind (down 50 per cent), and battery storage (down 84 per cent).
There are more cost falls to come, but the switch to cheaper power is starting to show benefits, which will increase as more wind and solar, more storage, and more equipment such as synchronous condensers further reduces the dependence on gas.
Utilities such as AGL are already switching to fast-start generators that can be quickly switched on and off to reflect the changing dynamics.

