There have been several instances in recent months when wind energy has accounted for all, or nearly all, electricity demand in South Australia. Last Tuesday, however, set a new benchmark – the combination of wind energy and rooftop solar provided more than 100 per cent of the state’s electricity needs, for a whole working day between 9.30am and 6pm.
The data comes from Hugh Saddler, at consultants Pitt & Sherry, and is part of his monthly overview of electricity market, emissions and pricing trends in Australia.
Saddler notes there were several periods in South Australia from Saturday September 27, and over the following days, when wind generation was greater than total state NEM demand. (South Australia has nearly half the country’s wind capacity with around 1.5GW of wind energy).
It occurred briefly on Saturday afternoon, for much of Sunday, and again, most strikingly, between about 9.30am and 6.00pm on Tuesday, September 30, a normal working day.
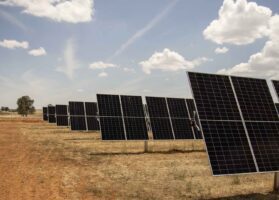
In reality, renewables contributed well over 100 per cent because they were generating and consuming their own electricity from rooftop solar – the state has 550MW of rooftop solar, with nearly one in four houses with rooftop modules.
That meant that “true” demand by consumers on that day, i.e. the amount of electricity being used by consumers, including rooftop solar, was in fact considerably higher than NEM demand — up to 20 per cent according to the Australian Photovoltaic Institute — because of the contribution of rooftop PV to total electricity supply.
Here are the two key graphs. The first shows wind generation (blueish line) exceeds total demand (green line) at several points, but particularly for large periods on September 30, the Tuesday.
The second graph (below) shows the contribution of rooftop solar, peaking at just over 20 per cent near noon. As we have reported, in previous weeks, the contribution of rooftop solar has been as much as 25 per cent for large parts of the working day.
The impact on the rest of the generation fleet was considerable. Saddler notes that during this period all of the thermal power stations in SA were shut down, with the exception of the two units at the coal fired Northern Power station, each of which ran at about 60 per cent of full load, and one of the four units at the gas fired Torrens Island B station, which was running at about 25 per cent of full load.
Interestingly, the South Australia government has already exceeded its target of generating 33 per cent of the state’s electricity needs from renewables (over a full year), and has now set a 50 per cent target by 2025. In reality, it will likely reach that mark well before that, particularly if the Ceres wind farm and the Hornsdale wind farm are built. It could even be the first mainland state towards 100 per cent renewables over the whole year.
Considerable volumes of electricity were exported to Victoria. “In simple arithmetic terms, though not of course in how the grid actually operated, the state’s electricity supply was 100 per cent renewable while coal and gas fired electricity was exported,” he says.
Those two graphs show the wind generation and its impact on pool prices in SA and Victoria from the Saturday to the Wednesday. Saddler writes: “The inverse relationship between wind generation and pool prices is very clear — the more wind generation, the lower the price, on average.”


