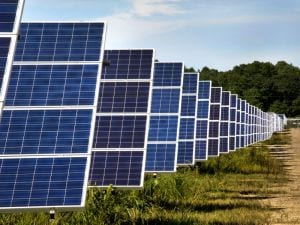
Australia’s booming large-scale solar market has helped to push renewables past a 30 per cent share of grid power generation on every other day for the month of June, despite it being the first month of winter.
The trend, illustrated in the latest edition of the Renewable Energy Index from analysts Green Energy Markets, puts renewable energy’s share of overall generation across the main grids of the east and west coast at 22.3 per cent.
But the report’s author, Tristan Edis, says this averaged figure disguises the extent of renewable energy’s emerging dominance over daytime hours, thanks mainly to an installed solar capacity that has doubled since 2017.
 Indeed, this phenomenon was illustrated clearly just over a week ago, when the spot price of electricity on all the state-based grids in Australia’s main wholesale market hit zero at the very same time early on a Sunday afternoon.
As Giles Parkinson reported, at the time of the zero pricing event, wind was providing 12.3 per cent of supply in the National Electricity Market, while the combination of rooftop solar and utility-scale solar was providing 22.5 per cent.
The total share of renewables was hovering up around 43 and 44 per cent – well ahead of total black coal and nearly three times the output of brown coal.
But, as the GEM data suggests, these sort of percentages are becoming less and less surprising, with solar output now large enough to consistently push the overall renewables share above 30 per cent during the middle of a winter’s day – which it did for 20 out of 30 days across June.
“The solar boom that began in the last quarter of 2016 is now having a marked impact on the east coast’s National Electricity Market, even in winter,” the report says.
As the chart below illustrates, the pattern is for the renewables share to ramp up rapidly after 7am, peak around midday close to 30 per cent, and then decline in the afternoon in line with the output from solar systems.
Then from 8pm until 6am, the renewables share of generation remains relatively stable at around 17 per cent, with important contributions from hydro in the morning and evening, when solar’s contribution is low.
But what does it all mean for the grid, and for the near-term future of renewable energy development?
As Edis – and others – have warned, the price impact of a high renewables share of the National Electricity Market could, combined with the wind up of the RET, result in a slowdown in big wind and solar development.
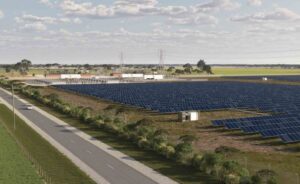
Another unintended consequence, as RenewEconomy has noted before, could also be that some utility-scale solar farms find themselves being switched off if it looks like wholesale prices are going negative for a lengthy period.
For others, data like that from GEM is merely further evidence of the increasingly pressing need for of grid-scale energy storage, which was named as a new priority for the Clean Energy Finance Corporation in the coming financial year.
“It will be very interesting to see what happens in Spring, with a few more projects online and when solar irradiance picks up while demand for electricity will be low,” Edis said.
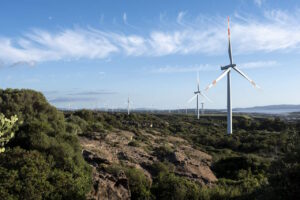
For now, however, the build-out of large-scale solar and wind shows no sign of slowing, with a total of 9,726MW of both currently under construction.

